Ethereum is in a crucial phase, with an inverted head and shoulders pattern forming on the daily chart and a double-bottom pattern on the 4-hour chart, both pointing toward the possibility of a slight bullish reversal.
The $2.7K neckline and $2.1K support level will be key areas to watch, as a breakout or breakdown will determine the next primary direction.
Technical Analysis
By Shayan
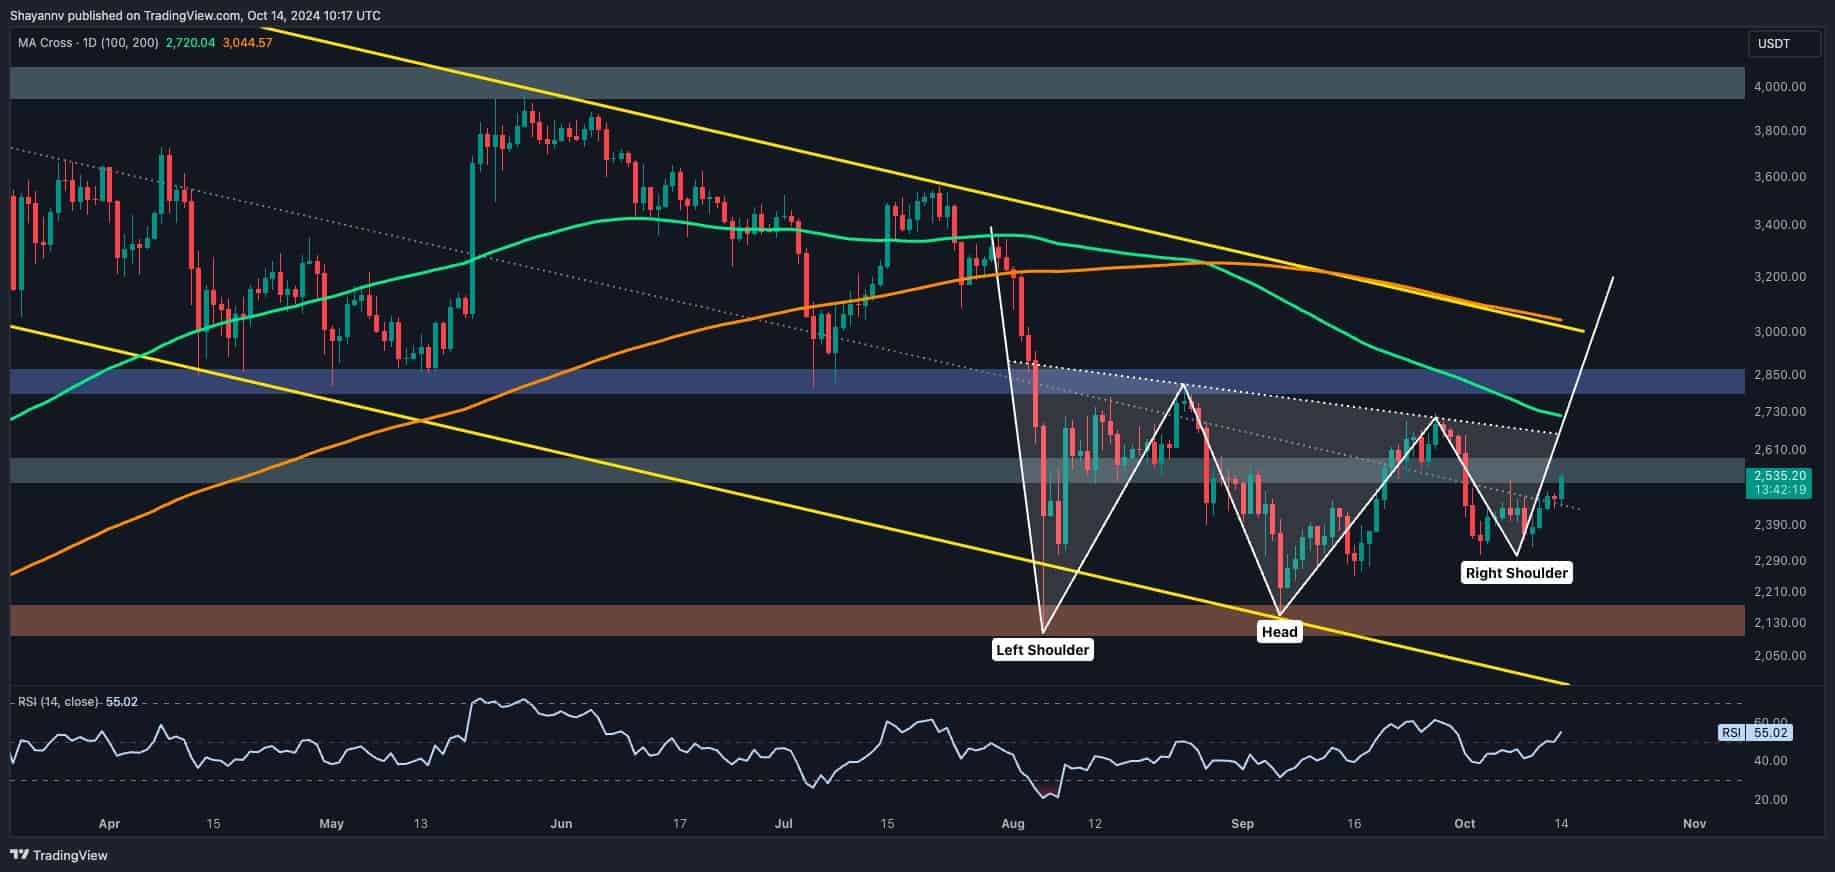
The Daily Chart
Ethereum is undergoing a descending consolidation phase, with no clear directional bias emerging recently. However, an important inverted head and shoulders pattern has formed near the $2.1K support zone, a critical level where buyers have managed to hold ground.
This pattern is typically a bullish reversal signal, suggesting that a shift towards upward momentum may be on the horizon, particularly if ETH can break through the neckline, which is around $2.7K.
Ethereum has roughly reclaimed the midpoint of the multi-month channel, which lies around $2.5K. If this breakout turns out to be valid, buyers’ next focus will shift to the neckline of the inverted head-and-shoulders pattern at $2.7K. A breakthrough at this level could solidify a bullish reversal, potentially targeting the $3K resistance zone in the near term.
Source: TradingView
The 4-Hour Chart
On the 4-hour chart, Ethereum sellers have struggled to push the price below the ascending flag pattern’s lower boundary, which sits near $2.3K. This dynamic support level has been tested multiple times, and a breach here could trigger a long-squeeze event, sending the price rapidly down to the $2.1K support region. However, Ethereum has also formed a double-bottom pattern in this timeframe, which typically signals a short-term bullish reversal.
The price is currently confined between the ascending flag’s support and a critical resistance zone defined by the 0.5 Fibonacci level at $2.6K and the 0.618 Fibonacci level at $2.8K. Ethereum will likely continue consolidating within this tight range until a decisive breakout, either upward or downward, occurs.
Source: TradingView
Onchain Analysis
By Shayan
Ethereum is currently trapped within a price range between $2.1K and $2.7K, and a detailed look at the Binance liquidation heatmap reveals the key liquidity zones that could influence an impending breakout. The heatmap displays regions of concentrated liquidity, such as stop-loss orders and liquidation levels, which are predominantly driven by more significant market participants, including whales.
The cryptocurrency faces a period of slight consolidation with minimal volatility, reflecting the equilibrium between buyers and sellers. On the downside, the $2K region is heavily defended by whales and institutional traders, as evidenced by significant liquidity pools concentrated in this area. On the other hand, the $2.8K resistance zone represents a formidable barrier, as it holds a significant amount of liquidity.
This liquidity concentration suggests that many traders, particularly large ones, have placed their liquidation points around this price level, making it critical. A breakout in either direction could lead to a liquidation cascade, triggering a chain reaction of stop-loss orders and liquidations that could amplify the prevailing trend.
Source: CoinGlass
The post Ethereum Price Analysis: Is ETH About to Break Above $2.6K at Last? appeared first on CryptoPotato.