

Part 3: Setting up user authentication and personalized reporting
This Part 3 is a continuation of Part 2 of our blog series. If you haven’t read Part 1 and Part 2 of this series, it’s advisable that you do so to understand how we got to this stage.
Tutorial Outline
For reference, here are the previous parts of this blog series:
Part 1: Build a finance tracker app – Setting up Strapi & implementing the app’s CRUD functionalities
Part 2: Build a finance tracker app – Adding visualization with charts
Part 3: Setting up user authentication and personalized reporting
We’ll add some protection for Part 3 of this blog series to prevent unauthorized access to our application.
Configure Settings in Strapi
Strapi provides built-in authentication and user management features, including roles and permissions. Follow these steps to configure these settings and set roles and permissions.
Create Roles and Permissions:
Navigate to the Strapi admin panel.
Go to the USERS & PERMISSIONS PLUGIN section.
Click on the option – Roles.
Configure the permissions for authenticated and public roles according to your application’s needs. To do this, select the ‘Authenticated‘ option.
Scroll down the page that opens up and toggle the ‘Users-permission‘ dropdown.
Under the ‘Auth‘ section, tick the ‘connect’ and ‘register’ checkboxes.
Under the ‘Roles‘ section, tick the ‘createRole’, ‘find’, and ‘findOne’ checkboxes.
Under the ‘User‘ section, tick the ‘create’, ‘find’, ‘me’, and ‘findOne’ checkboxes.
Save your configuration.
Create The Authentication Page in Next.js
We’ll start by creating our folder structure layout for these authentication pages. We need two pages for authentication: the signup page and the login page.
Remember, in Part 1 of this blog series, we made the ‘Overview’ page the first page displayed to the user when they enter the application. We’ll change it to be the page they’re navigated to after a successful signup and login, meaning we’ll make the sign-up/log-in page the main page of the application.
Page Layout for the Authentication Routes
Let’s create our components first.
In our app folder, we’ll create a new folder and name it auth. We’ll create two sub-folders in this newly created folder – ‘signup’ and ‘signin’.
In the ‘signup’ folder, we’ll also create a component called SignUp.tsx In the ‘signin’ folder, we’ll create two components – page.tsx and SignIn.tsx.
These will be the signup and sign-in form pages, which will contain forms for signing up and logging in to the application.
The layout will look like this:
┣ auth/
┃ ┣ signin/
┃ ┃ ┣ page.tsx
┃ ┃ ┗ SignIn.tsx
┃ ┗ signup/
┃ ┗ SignUp.tsx
┣ dashboard/
┣ globals.css
┣ head. tsx
┣ layout. tsx
┗ page.tsx
In the page.tsx component inside the app folder, the first page of the application will be changed from the overview dashboard page to the signup page.
To do this, we’ll change this page.tsx component from this:
import Overview from “./dashboard/Overview“;
const page = () => {
return (
<>
<div>
<SideNav />
<div>
<Overview />
</div>
</div>
</>
);
};
export default page;
To this:
import SignUp from “./auth/signup/SignUp“;
function App() {
return (
<div>
<SignUp />
</div>
);
}
export default App;
We’ll have to change the ‘Overview. tsx’ file name to ‘page.tsx’. The component will look like this now:
import React, { useState, useEffect } from ‘react‘;
import axios from ‘axios‘;
import BarChart from ‘./budget/BarChart‘;
import PieChart from ‘./budget/PieChart‘;
const page: React.FC = () => {
const [budgets, setBudgets] = useState<{ category: string; amount: number; }[]>([]);
const [chartType, setChartType] = useState<‘bar‘ | ‘pie‘>(‘bar‘);
useEffect(() => {
const fetchBudgets = async () => {
try {
const res = await axios.get(‘http://localhost:1337/api/budgets?populate=budget‘);
const data = res.data.data.map((budget: any) => ({
category: budget.attributes.category,
amount: budget.attributes.amount,
}));
setBudgets(data);
} catch (error) {
console.error(‘Error fetching budgets:‘, error);
}
};
fetchBudgets();
}, []);
const categories = budgets.map(budget => budget.category);
const amounts = budgets.map(budget => budget.amount);
return (
<main>
<div>
<h2>OVERVIEW</h2>
<div>
<button onClick={() => setChartType(‘bar‘)} className={`mx-2 py-2 px-3 ${chartType === ‘bar‘ ? ‘bg-teal-500 text-white‘ : ‘bg-gray-200 text-gray-700‘} rounded-lg`}>
Bar Chart
</button>
<button onClick={() => setChartType(‘pie‘)} className={`mx-2 py-2 px-3 ${chartType === ‘pie‘ ? ‘bg-teal-500 text-white‘ : ‘bg-gray-200 text-gray-700‘} rounded-lg`}>
Pie Chart
</button>
</div>
</section>
<section className=“mt-“>
{chartType === ‘bar‘ ? (
<BarChart categories={categories} amounts={amounts} />
) : (
<PieChart categories={categories} amounts={amounts} />
)}
</div>
</main>
);
};
export default page;
Note: This overview page was worked on in Part 2 of our series.
Creating the Forms
Let’s create the forms that will be used to authenticate users.
Create the sign-up form page
Let’s go to our SignUp.tsx component and paste these lines of code to build the sign-up form.
import React, { useState } from “react“;
import { FaEye, FaEyeSlash } from “react-icons/fa“;
import Link from “next/link“;
import axios from “axios“;
import { useRouter } from “next/navigation“;
const SignUp = () => {
const [username, setUsername] = useState(“”);
const [email, setEmail] = useState(“”);
const [password, setPassword] = useState(“”);
const [showPassword, setShowPassword] = useState(false);
const handleTogglePassword = () => {
setShowPassword((prevShowPassword) => !prevShowPassword);
};
const router = useRouter();
const handleSubmit = async (event: { preventDefault: () => void }) => {
event.preventDefault();
try {
const response = await axios.post(
“http://localhost:1337/api/auth/local/register“,
{
username,
email,
password,
},
);
console.log(response.data);
alert(“Registration successful!“);
// Clear the form inputs
setUsername(“”);
setEmail(“”);
setPassword(“”);
// Redirect to the login page
if (typeof window !== “undefined“) {
router.push(“/auth/signin“);
}
} catch (error) {
console.error(
“Registration failed:“,
error.response?.data || error.message,
);
alert(“Registration failed. Username or email invalid or already taken“);
}
};
return (
<main>
<h1>Sign up</h1>
<form onSubmit={handleSubmit}>
<div>
<label htmlFor=“username“>Username</label>
<input
type=“text“
placeholder=“Enter your username“
value={username}
onChange={(e) => setUsername(e.target.value)}
/>
</div>
<div>
<label htmlFor=“email“>Email</label>
<input
type=“email“
placeholder=“Enter your email address“
value={email}
onChange={(e) => setEmail(e.target.value)}
/>
</div>
<div>
<label htmlFor=“password“>Password</label>
<input
type={showPassword ? “text“ : “password“}
placeholder=“*******“
value={password}
onChange={(e) => setPassword(e.target.value)}
/>
<div onClick={handleTogglePassword}>
{showPassword ? <FaEyeSlash /> : <FaEye />}
</div>
</div>
<button type=“submit“>Sign Up</button>
</form>
<p>
{“ “}
Already have an account?
<Link href=“/auth/signin“>
<span>Login</span>
</Link>
</p>
</main>
);
};
export default SignUp;
Note: I don’t want the code to be too long, so I’ve omitted the styling for all the components in this article. You can check out the full TailwindCSS code later.
Code explanation:
We first have to set up state management to manage the states for username input, email input, password input, and showPassword for password visibility using the useState hook.
We created a handleTogglePassword function to handle the password visibility toggle.
Using the useRouter hook from Next.js, we handled page routing after a successful signup.
We created a handleSubmit function to send a POST request to the Strapi registration endpoint (http://localhost:1337/api/auth/local/register).
This function logs the response data to the console and displays an alert for successful signup. It then clears the form inputs and redirects us to the sign-in page (/auth/signin) upon a successful registration.
We then rendered the signup form UI with username, email, and password inputs.
Here’s what our signup page looks like after styling:
Create the sign-in form page
Inside our SignIn.tsx component that’s located inside the ‘signin‘ folder we created, we’ll paste these lines of code:
import React, { useState } from “react“;
import { FaEye, FaEyeSlash } from “react-icons/fa“;
import Link from “next/link“;
import axios from “axios“;
import { useRouter } from “next/navigation“;
const SignIn = () => {
const [email, setEmail] = useState(“”);
const [password, setPassword] = useState(“”);
const [showPassword, setShowPassword] = useState(false);
const router = useRouter();
const handleTogglePassword = () => {
setShowPassword((prevShowPassword) => !prevShowPassword);
};
const handleSubmit = async (event: { preventDefault: () => void }) => {
event.preventDefault();
try {
if (!email || !password) {
throw new Error(“Please fill in all fields.“);
}
const response = await axios.post(
“http://localhost:1337/api/auth/local“,
{
identifier: email,
password,
},
);
console.log(response.data);
alert(“Login successful!“);
// Save user information in local storage
localStorage.setItem(“user“, JSON.stringify(response.data.user));
// Redirect to the dashboard page
if (typeof window !== “undefined“) {
router.push(“/dashboard“);
}
} catch (error: any) {
console.error(“Login failed:“, error.response?.data || error.message);
alert(“Invalid login details“);
}
};
return (
<main>
<h1>Login</h1>
<form onSubmit={handleSubmit}>
<div>
<label htmlFor=“email“>Email</label>
<input
type=“email“
placeholder=“Enter your email address“
value={email}
onChange={(e) => setEmail(e.target.value)}
/>
</div>
<div>
<label htmlFor=“password“>Password</label>
<input
type={showPassword ? “text“ : “password“}
placeholder=“*******“
value={password}
onChange={(e) => setPassword(e.target.value)}
/>
<div onClick={handleTogglePassword}>
{showPassword ? <FaEyeSlash /> : <FaEye />}
</div>
</div>
<button type=“submit“>Sign in</button>
</form>
<p>
{“ “}
Don‘t have an account?
<Link href=”/”>
<span>Sign Up</span>
</Link>
</p>
</main>
);
};
export default SignIn;
Code explanation:
We set up state management to manage the states for email input, password input, and showPassword for password visibility using the useState hook.
The’handleTogglePassword’ function was set up to handle the password visibility toggle.
Using the useRouter hook from Next.js, we handled page routing to the dashboard.
Next, we created a handleSubmit function that sends a POST request to the Strapi authentication endpoint (http://localhost:1337/api/auth/local).
This function logs the response data to the console, displays an alert for successful sign-in, and saves our info in localStorage. It then clears the form inputs and redirects us to the dashboard page (/dashboard) upon successful sign-in.
Finally, we rendered the sign-in form with email and password input fields.
NOTE: Both sign-in and signup pages use similar functionality but handle different authentication endpoints (sign-in uses /api/auth/local, and signup uses /api/auth/local/register).
Here’s what our sign-in form looks like after styling:
You can include a more advanced form validation and error handling method like Formik, Zod, or any other library.
Set the route for the login page
In the page.tsx component located inside the ‘signin‘ folder, we’ll paste these lines of code:
import SignIn from “./SignIn“;
const page = () => {
return (
<>
<SignIn />
</>
);
};
export default page;
Add a ‘Log out’ button in your sidebar navigation that will navigate users back to the signup or sign-in page.
<section>
<FaSignOutAlt />
<span>Log out</span>
</section>
</Link>;
We can test out this functionality by inputting our registration details, logging in, and we’ll be directed to the dashboard page. If we go to the ‘Content-Type Builder’ page of our Strapi admin panel, we’ll to see the details we signed up with in the ‘User‘ collection type.
We didn’t need to create a collection type for the user’s details like we did with the budget, income, and expense collections. That’s because ‘User‘ is a collection type that’s available for use by default whenever we create a new Strapi project.
Update the dashboard main page
Let’s go to to the ‘page. tsx’ file located in our ‘dashboard’ folder and update the code to this:
import SideNav from “@/components/SideNav“;
import React, { useEffect, useState } from “react“;
import { useRouter } from “next/navigation“;
import axios from “axios“;
import BarChart from “./budget/BarChart“;
import PieChart from “./budget/PieChart“;
const page = () => {
const [budgets, setBudgets] = useState<
{ category: string; amount: number }[]
>([]);
const [chartType, setChartType] = useState<“bar“ | “pie“>(“bar“);
const [user, setUser] = useState<{ username: string; email: string } | null>(
null,
);
const router = useRouter();
useEffect(() => {
// Retrieve user data from local storage
const storedUser = localStorage.getItem(“user“);
if (storedUser) {
setUser(JSON.parse(storedUser));
} else {
// Redirect to login page if no user data is found
router.push(“/auth/signin“);
}
}, [router]);
useEffect(() => {
const fetchBudgets = async () => {
try {
const res = await axios.get(
“http://localhost:1337/api/budgets?populate=budget“,
);
const data = res.data.data.map((budget: any) => ({
category: budget.attributes.category,
amount: budget.attributes.amount,
}));
setBudgets(data);
} catch (error) {
console.error(“Error fetching budgets:“, error);
}
};
fetchBudgets();
}, []);
const categories = budgets.map((budget) => budget.category);
const amounts = budgets.map((budget) => budget.amount);
return (
<>
<main>
<SideNav />
<div>
<section>
<h2>OVERVIEW</h2>
{user && (
<p className=“mt-4 text-lg“>
Welcome {user.username ? user.username : user.email}!
</p>
)}
<div>
<button
onClick={() => setChartType(“bar“)}
className={`mx-2 py-2 px-3 ${chartType === “bar“ ? “bg-teal-500 text-white“ : “bg-gray-200 text-gray-700“} rounded-lg`}
>
Bar Chart
</button>
<button
onClick={() => setChartType(“pie“)}
className={`mx-2 py-2 px-3 ${chartType === “pie“ ? “bg-teal-500 text-white“ : “bg-gray-200 text-gray-700“} rounded-lg`}
>
Pie Chart
</button>
</div>
</section>
{budgets.length === 0 ? (
<div>
<p>No budget has been added, so no visuals yet.</p>
</div>
) : (
<section className=“mt-5“>
{chartType === “bar“ ? (
<BarChart categories={categories} amounts={amounts} />
) : (
<PieChart categories={categories} amounts={amounts} />
)}
</section>
)}
</div>
</main>
</>
);
};
export default page;
The things we added to this component include:
We imported SideNav component, along with the useRouter method from Next.js.
Next, we created a state to store the signed-in user’s details (username and email): const [user, setUser] = useState<{ username: string, email: string } | null>(null);.
We called the useRouter method and implemented the useEffect hook to retrieve user data from local storage where it was stored in the ‘Signin’ page.
If the stored user data is available, it is parsed in JSON format. We will be redirected back to the login page if our data isn’t found.
The username or email is then rendered in the overview page along with the charts like this:
Our app is almost ready at this point.
The Authentication Method used by Strapi
When we inspect our console in the browser, we should see the client-side code typically interacting with JWT tokens provided by the Strapi server during signup and sign-in.
That’s because Strapi’s server-side endpoints (/api/auth/local and /api/auth/local/register) handle JWT authentication internally.
For the Signup:
When we sign up, our credentials are usually sent to the server. After successful authentication, the server generates a JWT token containing our information and signs it with a secret key.
The JWT token is then returned to the client and stored securely, usually in local storage or a secure cookie.
For the Signin:
When we sign in, our credentials are sent to the server. After a successful authentication, the server generates a new JWT token or refreshes the existing token and returns it to the client.
To get a good understanding of this authentication method used in Strapi, take a look at beginners guide to authentication and authorization in strapi article.
Now, let’s move on to a more advanced feature: personalized financial reports in our finance tracker application.
Personalized Financial Report
We want to implement a feature that will enable us to generate a personalized report based on our financial data.
Let’s build!
Configuring the Strapi Backend
We’ll need to configure the Strapi backend to enable this functionality. So how do we go about this?
Let’s navigate to the Strapi backend folder of our project and follow the steps below:
We’ll first create a new file for our controller in ‘./src/api/report/controllers/report.js‘ and include these lines of code:
/**
* report controller
*/
// path: src/api/report/controllers/report.js
module.exports = {
async generate(ctx) {
const { budgets, incomes, expenses } = ctx.request.body;
if (!budgets.length && !incomes.length && !expenses.length) {
return ctx.badRequest(“No data available to generate report.“);
}
// Calculate totals and find max expense
const totalExpenses = expenses.reduce(
(sum, expense) => sum + expense.amount,
0,
);
const totalIncomes = incomes.reduce(
(sum, income) => sum + income.amount,
0,
);
let maxExpenseCategory = “N/A“;
let maxExpenseAmount = 0;
if (expenses.length > 0) {
const maxExpense = expenses.reduce(
(max, expense) => (expense.amount > max.amount ? expense : max),
expenses[0],
);
maxExpenseCategory = maxExpense.description;
maxExpenseAmount = maxExpense.amount;
}
// Analyze and generate personalized report
let report = “ “;
// budget report logic
if (budgets.length > 0) {
report += “Based on your data: “;
budgets.forEach((budget) => {
report += `Your budget for ‘${budget.category}‘ is ‘${budget.amount}‘, `;
});
report += “<br>“;
}
// income and expenses report logic
if (expenses.length > 0) {
report += `You are spending more on ${maxExpenseCategory} than other expenses. <br>`;
if (totalExpenses >= totalIncomes) {
report += `You’ve spent a total of <strong>$${totalExpenses}</strong> on expenses while having an inflow/income of <strong>$${totalIncomes}</strong>, meaning you’ve spent more than you earned. Oops!🙁. <br>`;
} else {
report += `You’ve spent a total of <strong>$${totalExpenses}</strong> on expenses while having an inflow/income of <strong>$${totalIncomes}</strong>, meaning you managed to spend less than you earned. Kudos 🎉. <br>`;
}
}
const createdReport = await strapi.query(“api::report.report“).create({
data: { report },
});
return ctx.send({ report: createdReport.report });
},
};
Controller code explanation:
First, we destructured to extract budgets, incomes, and expenses arrays from the request body.
We then validated the data. If all arrays are empty, it responds with a “Bad Request” error indicating no data is available to generate a report: if (!budgets.length && !incomes.length && !expenses.length) {
return ctx.badRequest(‘No data available to generate report.’);
}.
We calculated the total amounts for expenses and incomes and found the expense with the highest amount. If there are no expenses, it defaults to ‘N/A.
Then, we created a personalized report string based on the provided data. This string will include HTML tags for bold formatting and break lines.
We stored the generated report in the Strapi reports collection and sent the generated report as a response.
This controller file contains the logic for generating personalized financial reports based on user data.
This is just a basic report that we generated. Feel free to change the content of the report as best you see fit.
Next, we’ll create a file for our route configuration in ‘./src/api/report/routes/report.js‘ and include these lines of code:
/**
* report routes
*/
module.exports = {
routes: [
{
method: “POST“,
path: “/generate-report“,
handler: “report.generate“,
config: {
policies: [],
middlewares: [],
},
},
],
};
We’ll also create a file for schema in ‘./src/api/report/content-types/report/schema.json‘ and include these lines of code:
“kind”: “collectionType”,
“collectionName”: “reports”,
“info”: {
“singularName”: “report”,
“pluralName”: “reports”,
“displayName”: “Reports”,
“description”:” “
},
“options”: {
“draftAndPublish”: true
},
“pluginOptions”: {},
“attributes”: {
“report”: {
“type”: “text”
}
}
}
Here’s how our folder structure for these Strapi configuration files will look like now:
┣ content-types/
┃ ┗ report/
┃ ┗ schema.json
┣ controllers/
┃ ┗ report.js
┗ routes/
┗ report.js
We’ll need to stop our panel server from running in the terminal using the ‘cls’ command for windows powershell. Then we’ll run the server again with the npm run develop command to make sure Strapi is aware of our new controller, route, and schema.
Open up the server in the browser.
NOTE: Anytime you make changes to the Strapi backend, the server reloads.
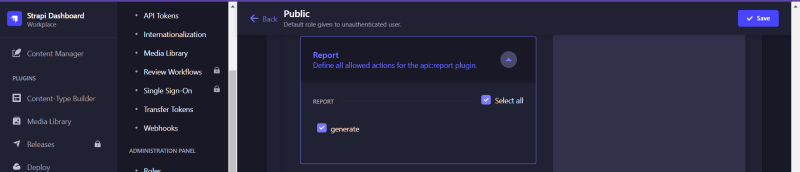
You’ll see that Strapi automatically created a ‘Report’ collection in the content-type builder due to the configurations made.
Let’s go to USERS AND PERMISSION PLUGINS settings, click ‘Roles’, and select the ‘Public’ option. We’ll look for the newly added ‘Report’ permission, toggle its dropdown, and tick the ‘generate’ button.
We’ll save it and wait for the panel to reload.
Updating the Frontend
What is left to do is to update the frontend code to implement the personalized report logic and display the report.
Let’s navigate to our ‘page. tsx’ file inside our “/src/app/dashboard/page.tsx” and include these lines of code:
We’ll create states to store the income, expenses, and report text.
{ description: string; amount: number }[]
>([]);
const [expenses, setExpenses] = useState<
{ description: string; amount: number }[]
>([]);
const [report, setReport] = useState<string | null>(null);
Next, we’ll create a fetchIncomesAndExpenses function inside the useEffect hook that’s handling the budget fetching. This function will retrieve income and expense data from the Strapi API and set the state for these data in the component:
const fetchIncomesAndExpenses = async () => {
try {
const incomeRes = await axios.get(“http://localhost:1337/api/incomes“);
const expenseRes = await axios.get(“http://localhost:1337/api/expenses“);
const incomeData = incomeRes.data.data.map((income: any) => ({
description: income.attributes.description,
amount: income.attributes.amount,
}));
const expenseData = expenseRes.data.data.map((expense: any) => ({
description: expense.attributes.description,
amount: expense.attributes.amount,
}));
setIncomes(incomeData);
setExpenses(expenseData);
} catch (error) {
console.error(“Error fetching incomes and expenses:“, error);
}
};
We’ll need to call the function in the useEffect hook like this: fetchIncomesAndExpenses();
Then, we’ll create a separate generateReport function to send a POST request to the new Strapi API to generate personalized financial reports based on the current budget, income, and expense data.
If the request is successful, the generated report from the response is set in the component state using setReport. If the request fails, an error message is logged to the console, and a message alert is displayed on the app.
try {
const res = await axios.post(“http://localhost:1337/api/generate-report“, {
budgets,
incomes,
expenses,
});
setReport(res.data.report);
} catch (error) {
console.error(“Failed to generate report:“, error);
alert(“Failed to generate report“);
}
};
Lastly, we’ll render a button that generates the report when it is clicked. We’ll also render the report using the dangerouslySetInnerHTML property to render the HTML string.
<button onClick={generateReport}>Generate Report</button>
</div>;
{
report && (
<div>
<h3>Financial report</h3>
<div dangerouslySetInnerHTML={{ __html: report }}></div>
</div>
);
}
NOTE: You can view the full complete code for the now updated ‘page.tsx’ component here.
We’ll go to our browser, refresh the web app to ensure changes are reflected. In our overview page, at the bottom, click the “Generate report” button. We’ll get a simplified report of our financial data.
When we go to the ‘Content Manager’ section in your Strapi admin panel, we’ll see that the generated report was created as an entry in the ‘Report’ collection.
There you have it. Our finance tracker application is functional and ready for use.
You can generate a more comprehensive report using this technique.
Here’s a quick demo of the report generation feature.
If you make any changes to your financial data (budget, income, expenses), the page refreshes and you can generate a new report to reflect the changes made.
Printing and Exporting Generated Report
If we want someone else to be able to view this report, we can add a functionality that allows us to export the report as PDF.
For example, if we want to export only the budget data report, including either of the charts, we can omit the part that analyzes the income and expenses in the report.js file in the controllers.
Let’s only generate a report for the budget data so we can export the budget report.
So how do we print and export this data report along with the chart? Here’s how we’ll do it.
We’ll use three libraries – html-to-pdfmake, pdfmake and html2canvas for the printing functionality.
The html-to-pdfmake library is for generating PDFs from HTML content. The pdfmake library is used to generate PDFs for both client-side and server-side, allowing us to create PDFs from structured data. The html2canvas library will be used to capture the chart as an image, and then the image will be included in the PDF document generated by the pdfmake library.
We’ll have to install these libraries using this command:
”
Update our overview component, like this:
First, we’ll import the installed libraries.
import pdfMake from ‘pdfmake/build/pdfmake‘;
import pdfFonts from ‘pdfmake/build/vfs_fonts‘;
import html2canvas from ‘html2canvas‘;
Next, we’ll add this under the imports: pdfMake.vfs = pdfFonts.pdfMake.vfs;
We’ll create a printReport function that will convert the HTML content of the report to a PDF and trigger a download. This function will capture the chart as an image using the html2canvas package. It will then convert the chart image and the HTML content of the report to a PDF document, including the captured chart image.
try {
const printContent = document.getElementById(“report-content“)?.innerHTML;
const chartCanvas = chartRef.current;
if (printContent && chartCanvas) {
const canvas = await html2canvas(chartCanvas);
const chartImage = canvas.toDataURL(“image/png“);
const docDefinition = {
content: [
{ text: “Financial Report“, style: “header“ },
{ image: chartImage, width: 500 },
htmlToPdfmake(printContent),
],
styles: {
header: {
fontSize: 18,
bold: true,
margin: [0, 0, 0, 10],
},
},
};
pdfMake.createPdf(docDefinition).download(“financial_report.pdf“);
}
} catch (error) {
console.error(“Failed to generate PDF:“, error);
}
};
We’ll also import a useRef hook at the top of our file and use this hook to get a reference to the chart section in the DOM, like this:
const chartRef = useRef(null);
Here’s how we’ll add the ref to the ‘Chart’ Section:
{chartType === “bar“ ? (
<BarChart categories={categories} amounts={amounts} />
) : (
<PieChart categories={categories} amounts={amounts} />
)}
</section>;
We’ll then include the button to export the report as a PDF. This button will call the printReport function:
Export as PDF
</button>
Save the file and refresh the webpage.
Now, when we generate a report by clicking the “Generate report” button, our budget report is generated along with an “Export as PDF” button. When we click this button, our report will be exported as PDF, and it will automatically download the report as PDF to your system.
Feel free to style your report in any way you want it to appear in the PDF inside the printReport function.
If we want to download a copy of the report with the pie chart instead of the bar chart, we’ll switch the chart type to ‘pie chart’ on the web page. Click the “Generate report” button again and export.
If we want to enable cashflow statement report generation for the income and expenses, we’ll follow the same steps and export it the same way.
This is the GitHub repo for this article.
Series Wrap Up
In this “Build a Finance Tracker with Next.js, Strapi, and Chart.js” blog series, here’s a summary of what we learned:
How to set up Strapi, build the frontend UI, connect the frontend to Strapi, and implement the CRUD functionalities for the data.
How to integrate Chart.js to create charts/visuals of our financial budget data.
How to authenticate users and configure the Strapi backend to implement a personalized report feature.
How to print and export generated reports.
This app can be used by individuals hoping to manage their finances, observe their spending habits, track their financial data, and get a simplified report of their finances.
I hope you enjoyed this series and were able to code along with me and build your own finance tracker application.


