Ethereum’s recent failure to reclaim the multi-month descending channel’s middle threshold of $2.6K has resulted in a significant rejection, signaling a possible continuation of the downtrend toward the mid-term $2.1K support level.
Technical Analysis
By Shayan
The Daily Chart
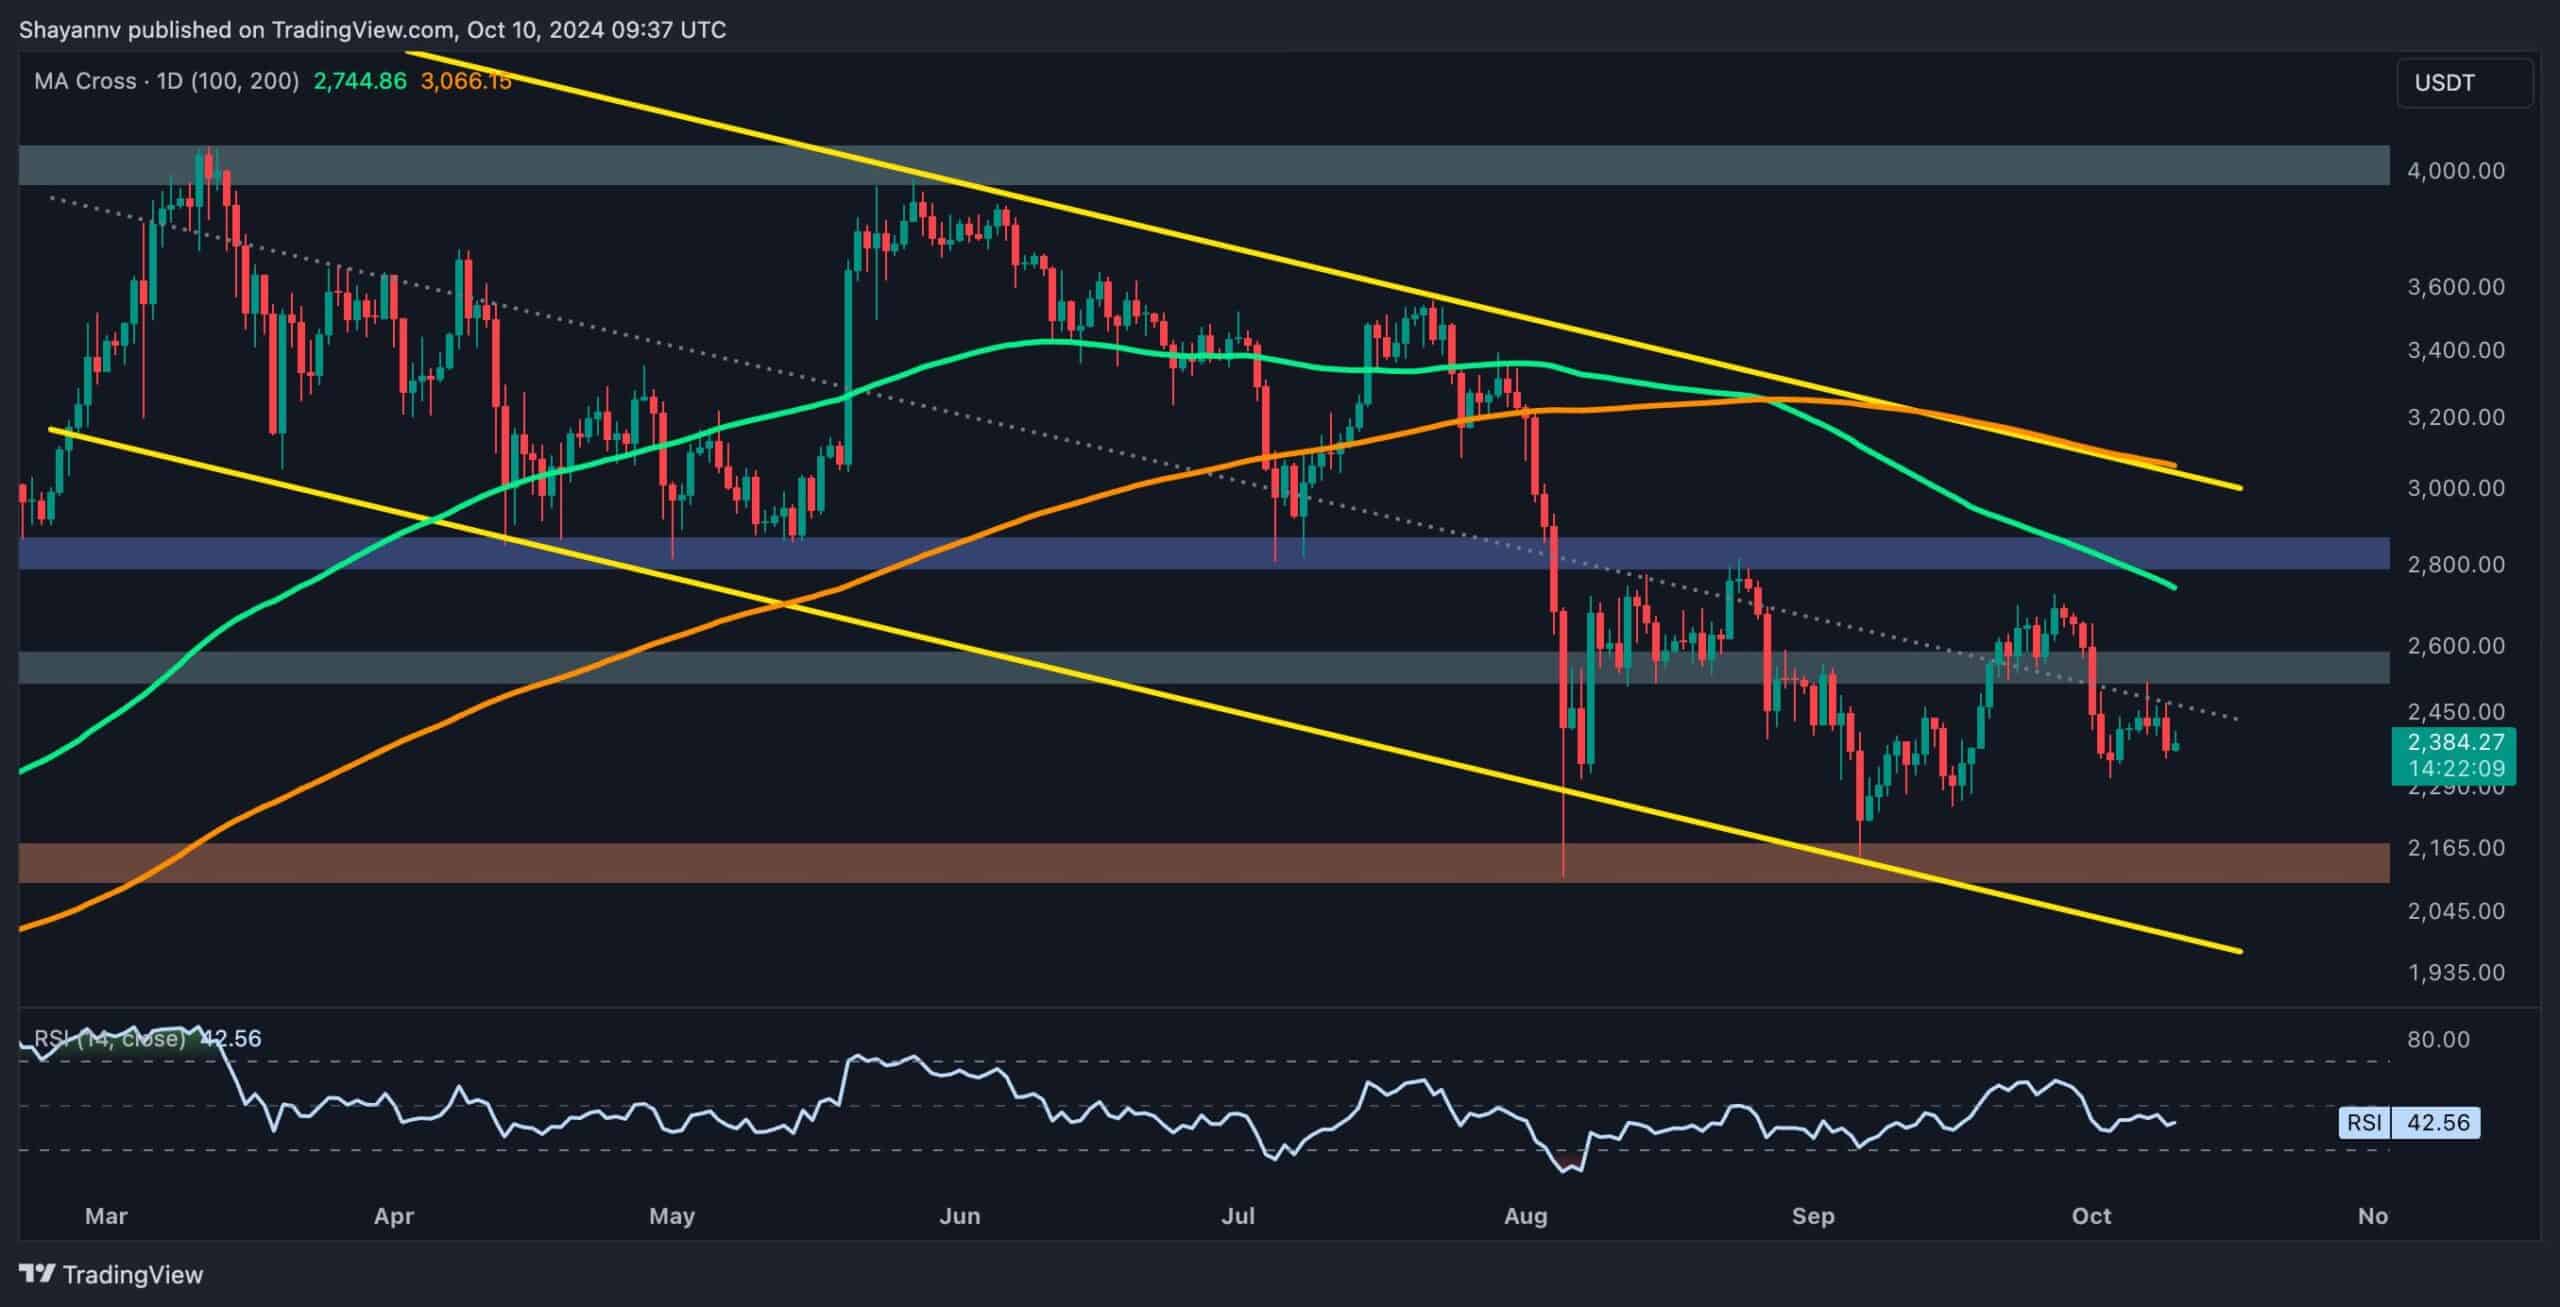
Ethereum’s price movement on the daily chart reflects a bull trap. After briefly surpassing the $2.6K resistance, the price quickly lost momentum due to intense selling pressure, leading to a 15% drop.
This rejection underscores the dominance of sellers in the market, as ETH failed to reclaim this critical threshold. Adding to the bearish sentiment, a “Death Cross” has occurred, where the 100-day moving average crossed below the 200-day moving average, a historically bearish signal.
The market is now poised for a further retracement toward the $2.1K support zone, which aligns with a prior significant swing low. Ethereum is expected to enter a descending consolidation phase, gradually trending lower toward this key level in the mid-term.
Source: TradingView
The 4-Hour Chart
On the 4-hour chart, ETH’s struggle to maintain momentum near the 0.5 ($2.6K) – 0.618 ($2.8K) Fibonacci levels triggered a steep decline toward the ascending flag’s lower boundary of $2.3K. Ethereum is currently hovering around this support level, with low volatility and sideways consolidation, signaling market indecision.
Although buyers or sellers have no explicit control at the moment, the bearish momentum suggests that they are trying to push the price below the flag’s lower boundary.
If Ethereum breaks below this level, it could trigger a sustained negative trend, targeting the $2K psychological support. However, the $2.1K threshold remains a crucial defense for buyers to prevent further decline.
Source: TradingView
Onchain Analysis
By Shayan
The provided chart highlights a stark contrast between the performance of Bitcoin and Ethereum ETFs over the 79 days since their launch. The divergence in investor behavior suggests different demand and confidence levels between these two cryptocurrencies, with Bitcoin showing substantial inflows and Ethereum struggling to attract interest.
As of Day 79, Bitcoin ETFs have amassed $29.1 billion in inflows, with total assets under management increasing from $29.2 billion at the start to a high of $58.3 billion before stabilizing around $59.7 billion. This growth reflects a steady and consistent demand for Bitcoin from investors.
In contrast, Ethereum ETFs have seen a net outflow of $4.1 billion over the same period, with AUM declining from $10.7 billion to $6.6 billion.
The continuous downtrend reflects weak demand, indicating that Ethereum, a dominant force in the broader crypto ecosystem, has not yet captured the same level of interest from ETF investors. This trend suggests that while both assets are pivotal in the cryptocurrency market, Bitcoin’s stability and institutional adoption currently make it the more attractive option in ETF products. At the same time, Ethereum may need to overcome short-term market concerns to regain its footing.
Source: CryptoQuant
The post Ethereum Price Analysis: Bears Eye $2K as ETH Loses Positive Momentum appeared first on CryptoPotato.