
Last week, Ethereum exhibited a significant bearish signal as the price completed a pullback to the lower boundary of a multi-month wedge. The 100-day moving average also crossed below the 200-day moving average, forming the well-known “Death Cross.”
This development has heightened expectations toward continuing the bearish trend toward the $2.1K threshold.
Technical Analysis
By Shayan
The Daily Chart
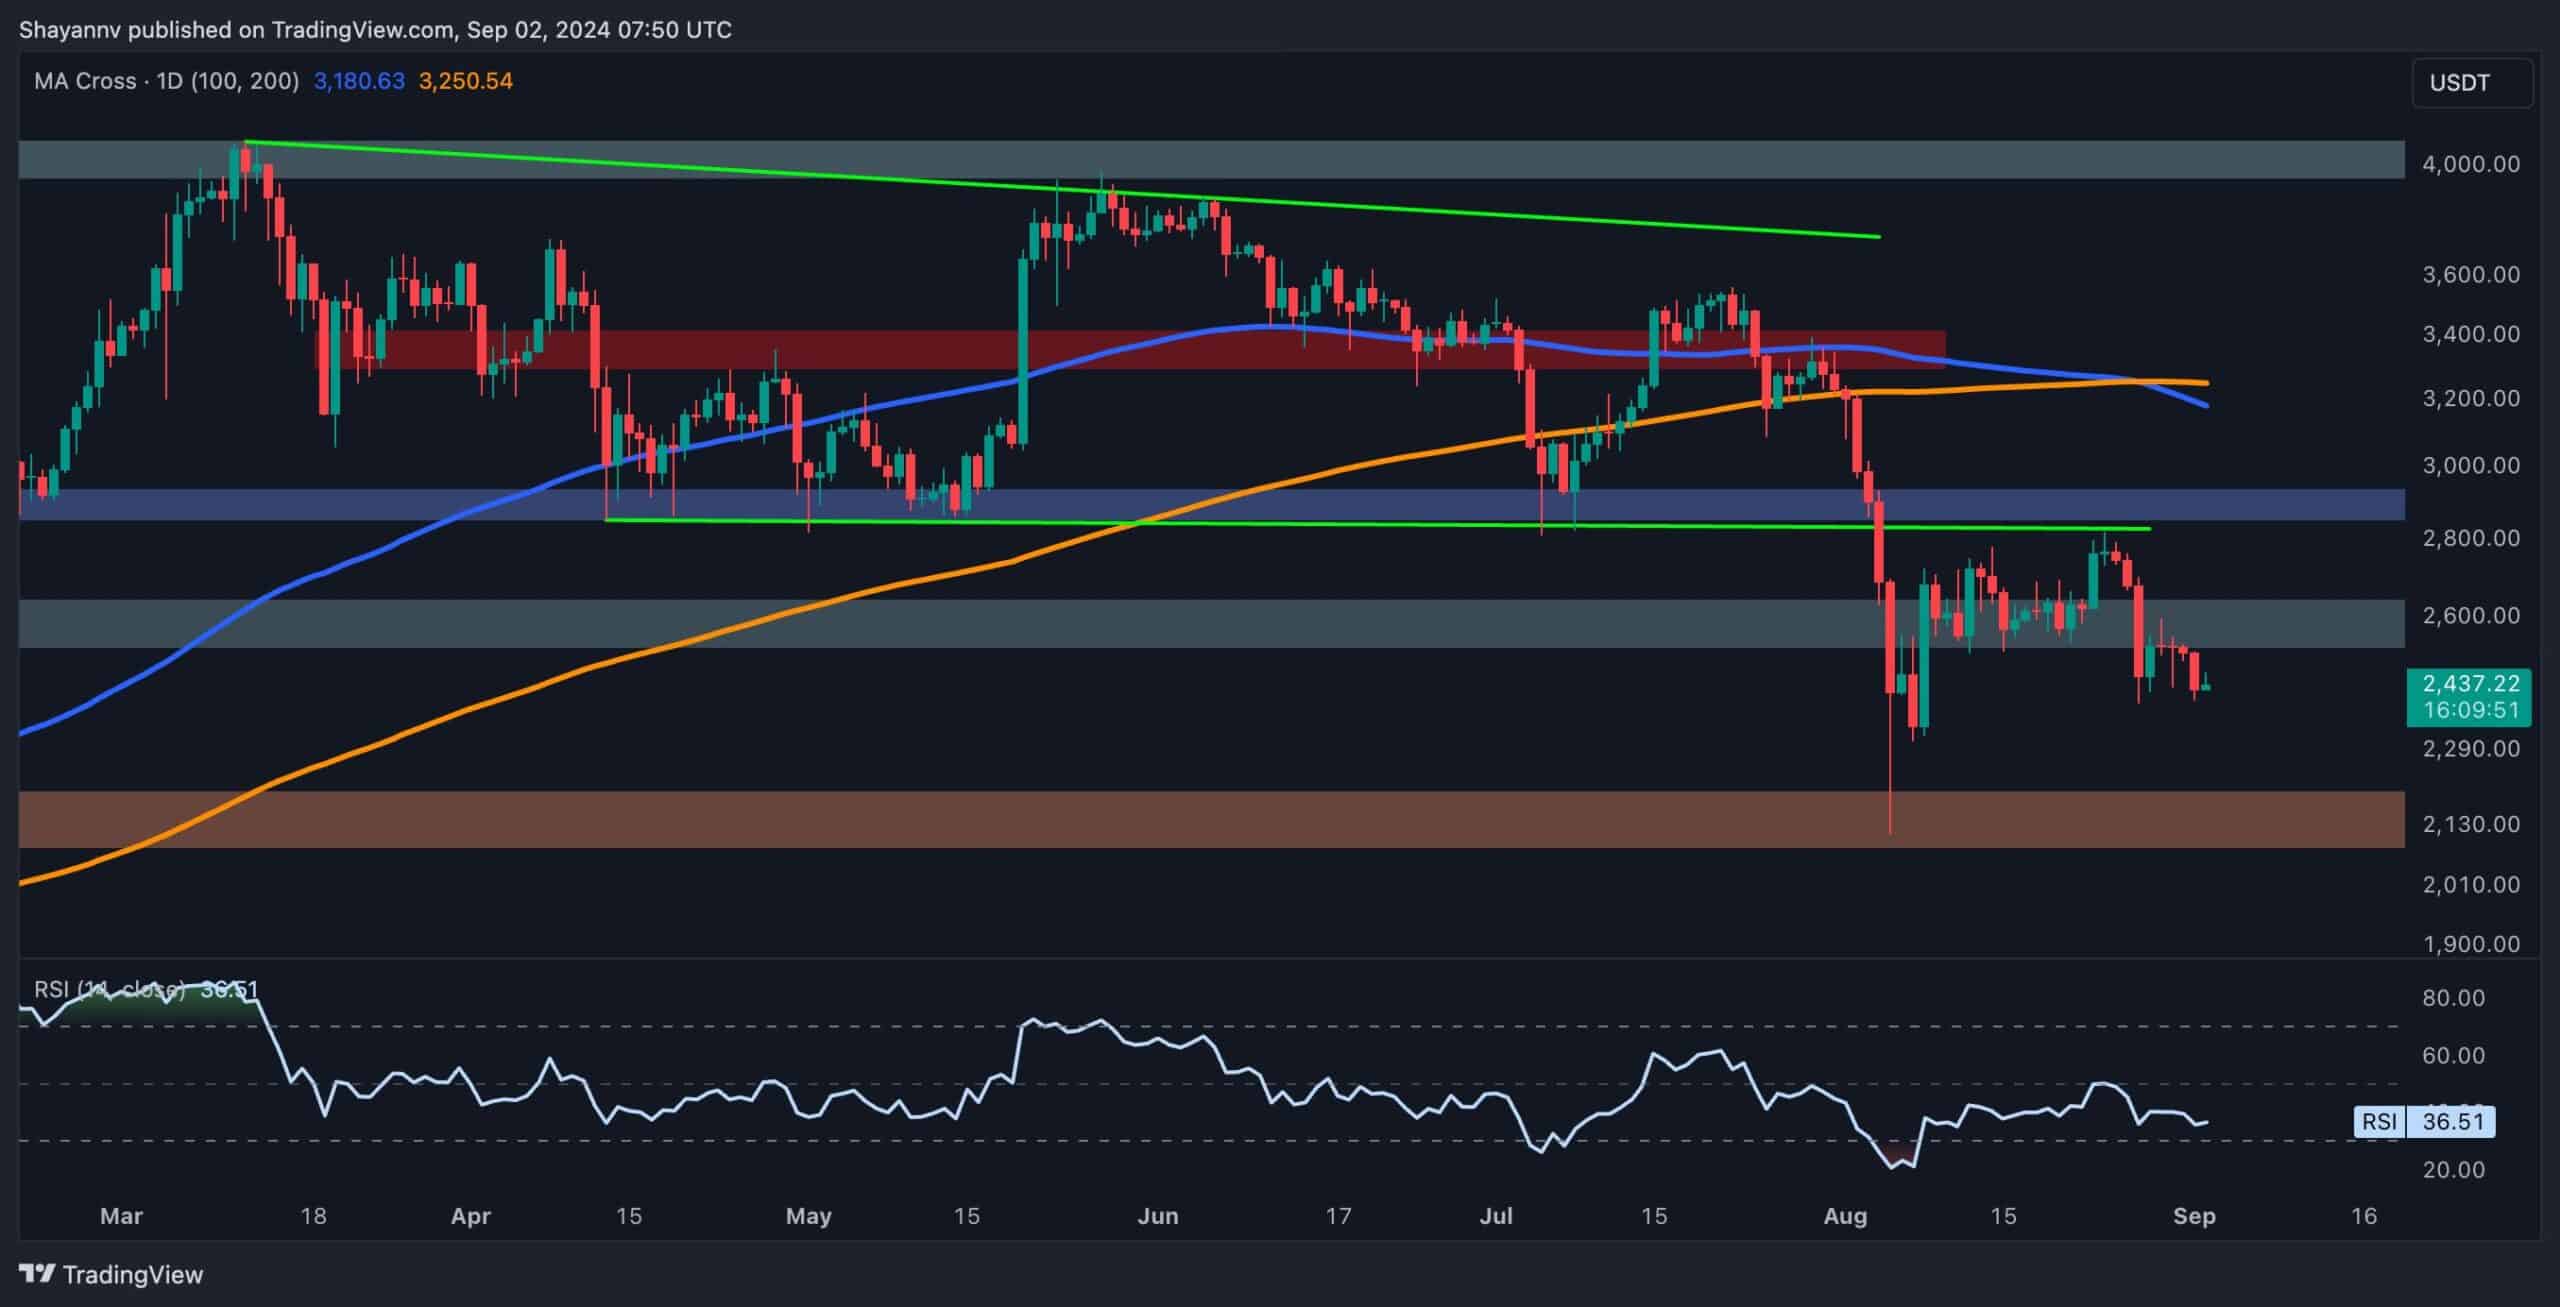
Ethereum has exhibited a pronounced bearish trend over the past few weeks, stirring fear and uncertainty among market participants. The price has completed a pullback to the lower boundary of a multi-month wedge, initiating a significant decline.
This bearish momentum is further reinforced by the formation of the “Death Cross,” where the 100-day moving average has crossed below the 200-day moving average, a classic bearish indicator. This development has resulted in a bearish market sentiment, leading to panic selling and increasing the likelihood of a continued downtrend toward the $2.1K support level in the near term.
The 4-Hour Chart
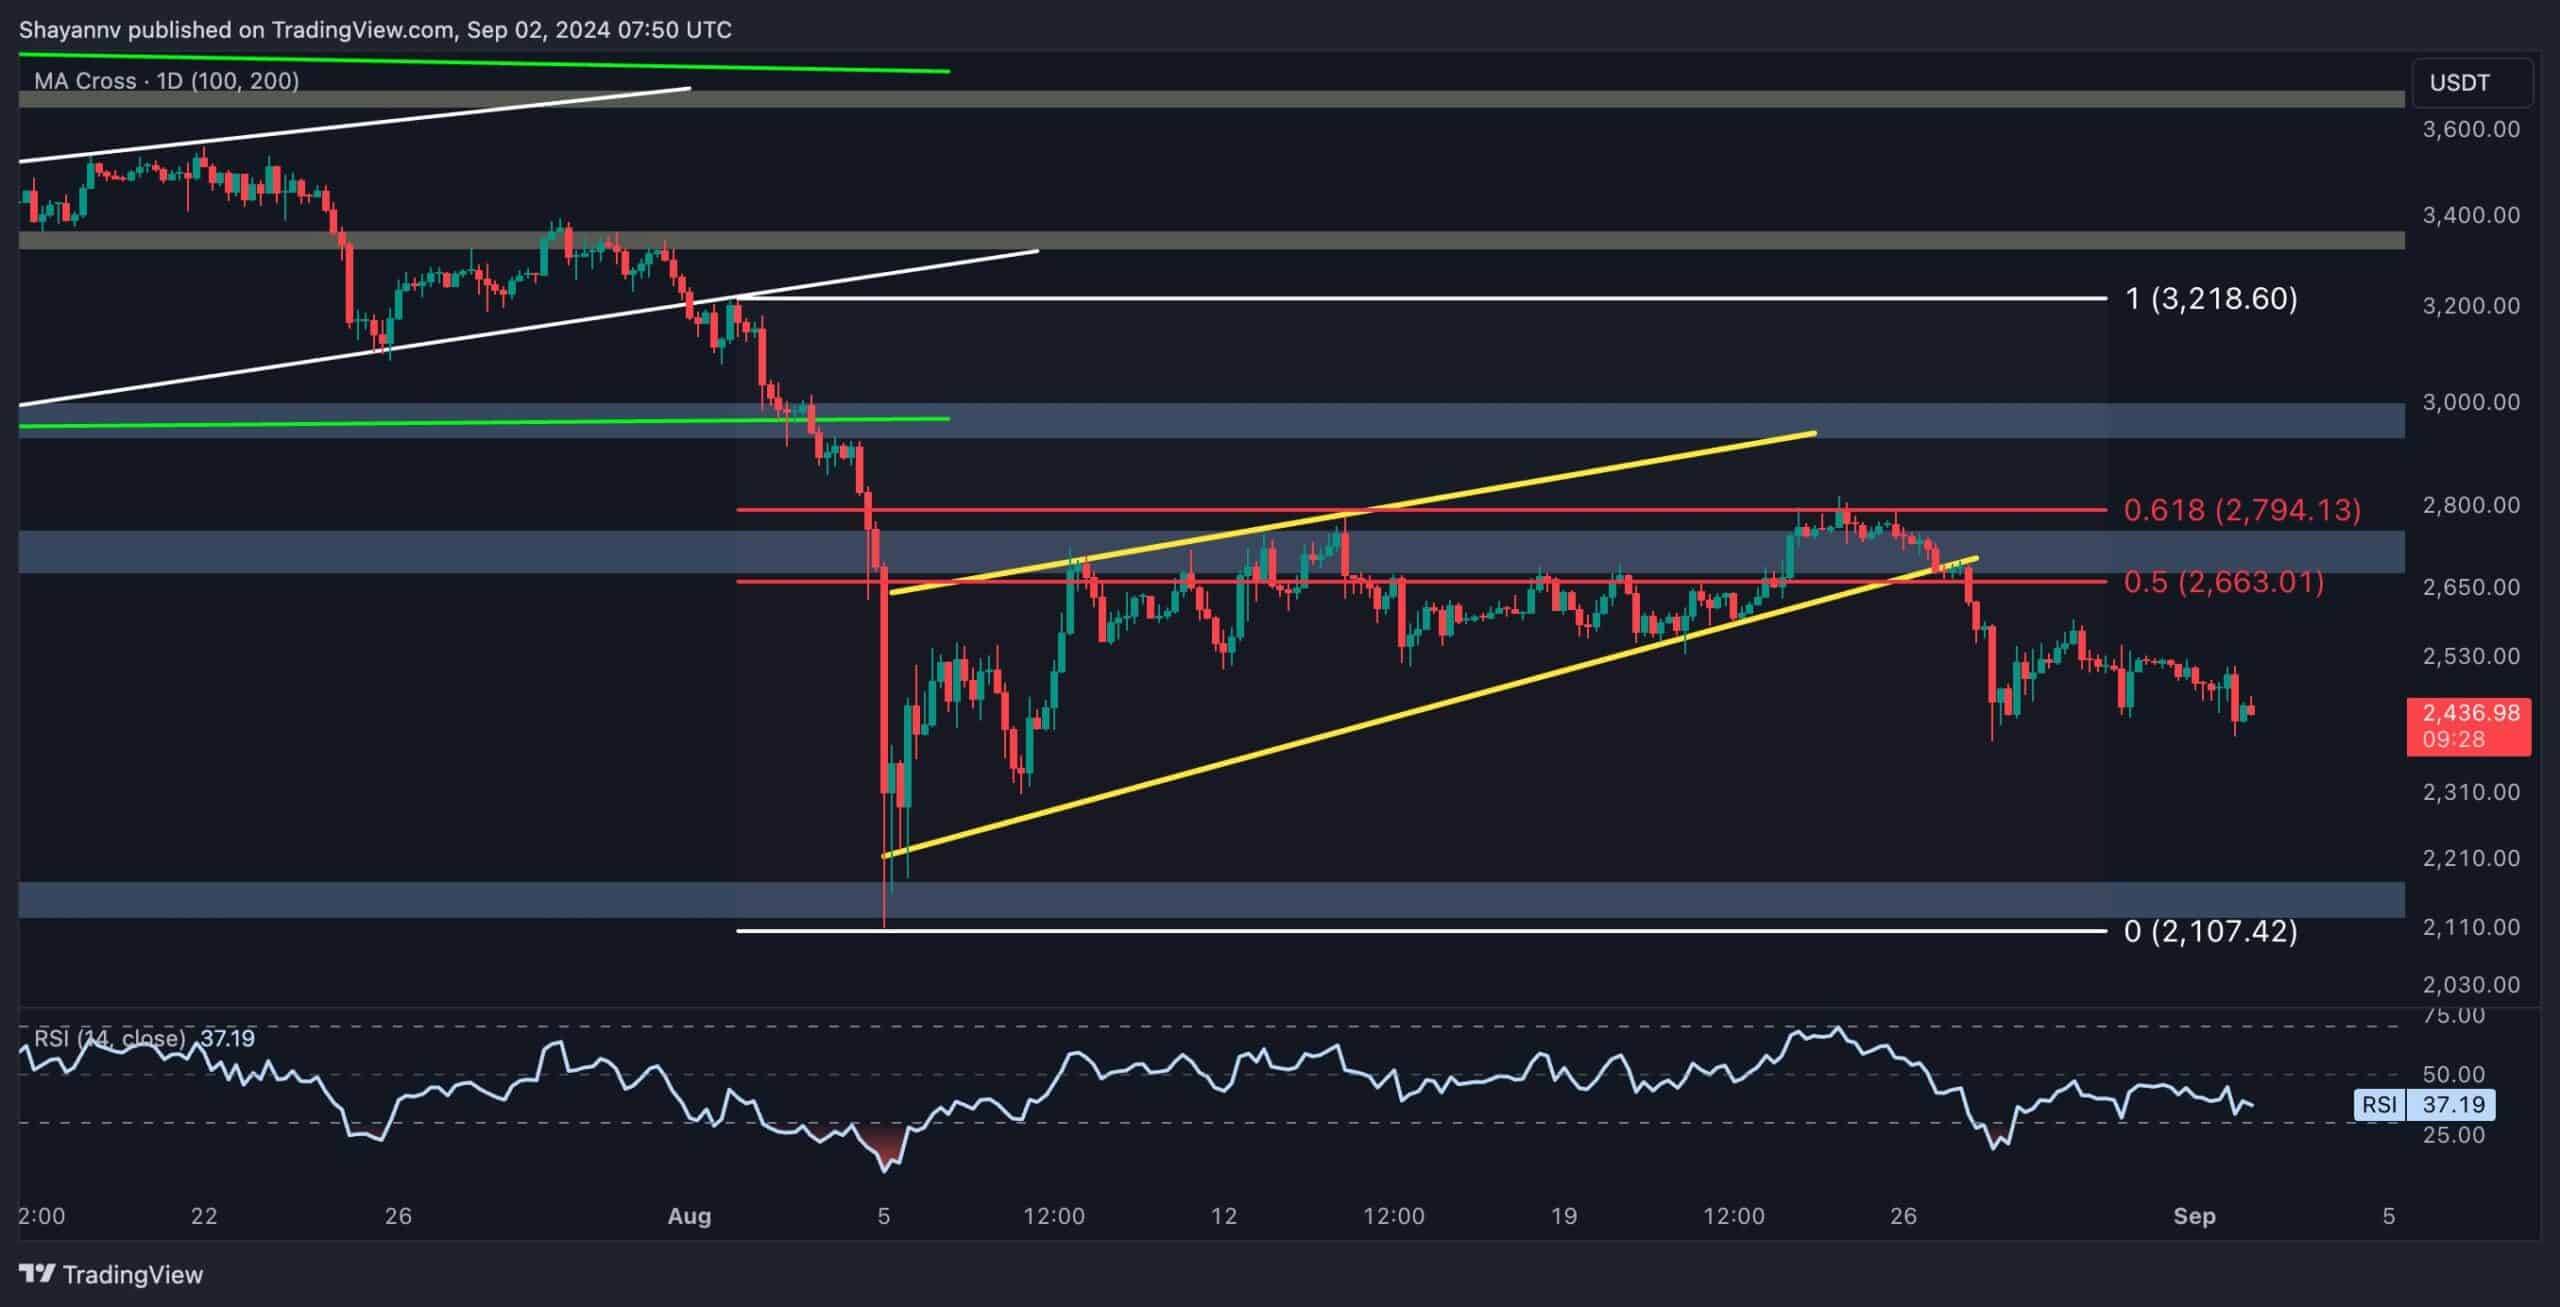
On the 4-hour chart, ETH encountered a firm rejection from the critical resistance zone between the 0.5 ($2.6K) and 0.618 ($2.7K) Fibonacci levels. This led to a sharp decline that broke through the lower boundary of a corrective ascending wedge. This breakdown signals a dominant bearish trend, with sellers driving lower prices. Recently, the asset attempted a pullback to the broken wedge, suggesting the potential for further bearish continuation.
Ethereum’s next significant support lies around the $2.1K level, where demand might resurface to halt the downward pressure temporarily. However, until this level is tested, the prevailing bearish trend is expected to persist, with the $2.1K threshold being the primary target for the short term.
Onchain Analysis
By Shayan
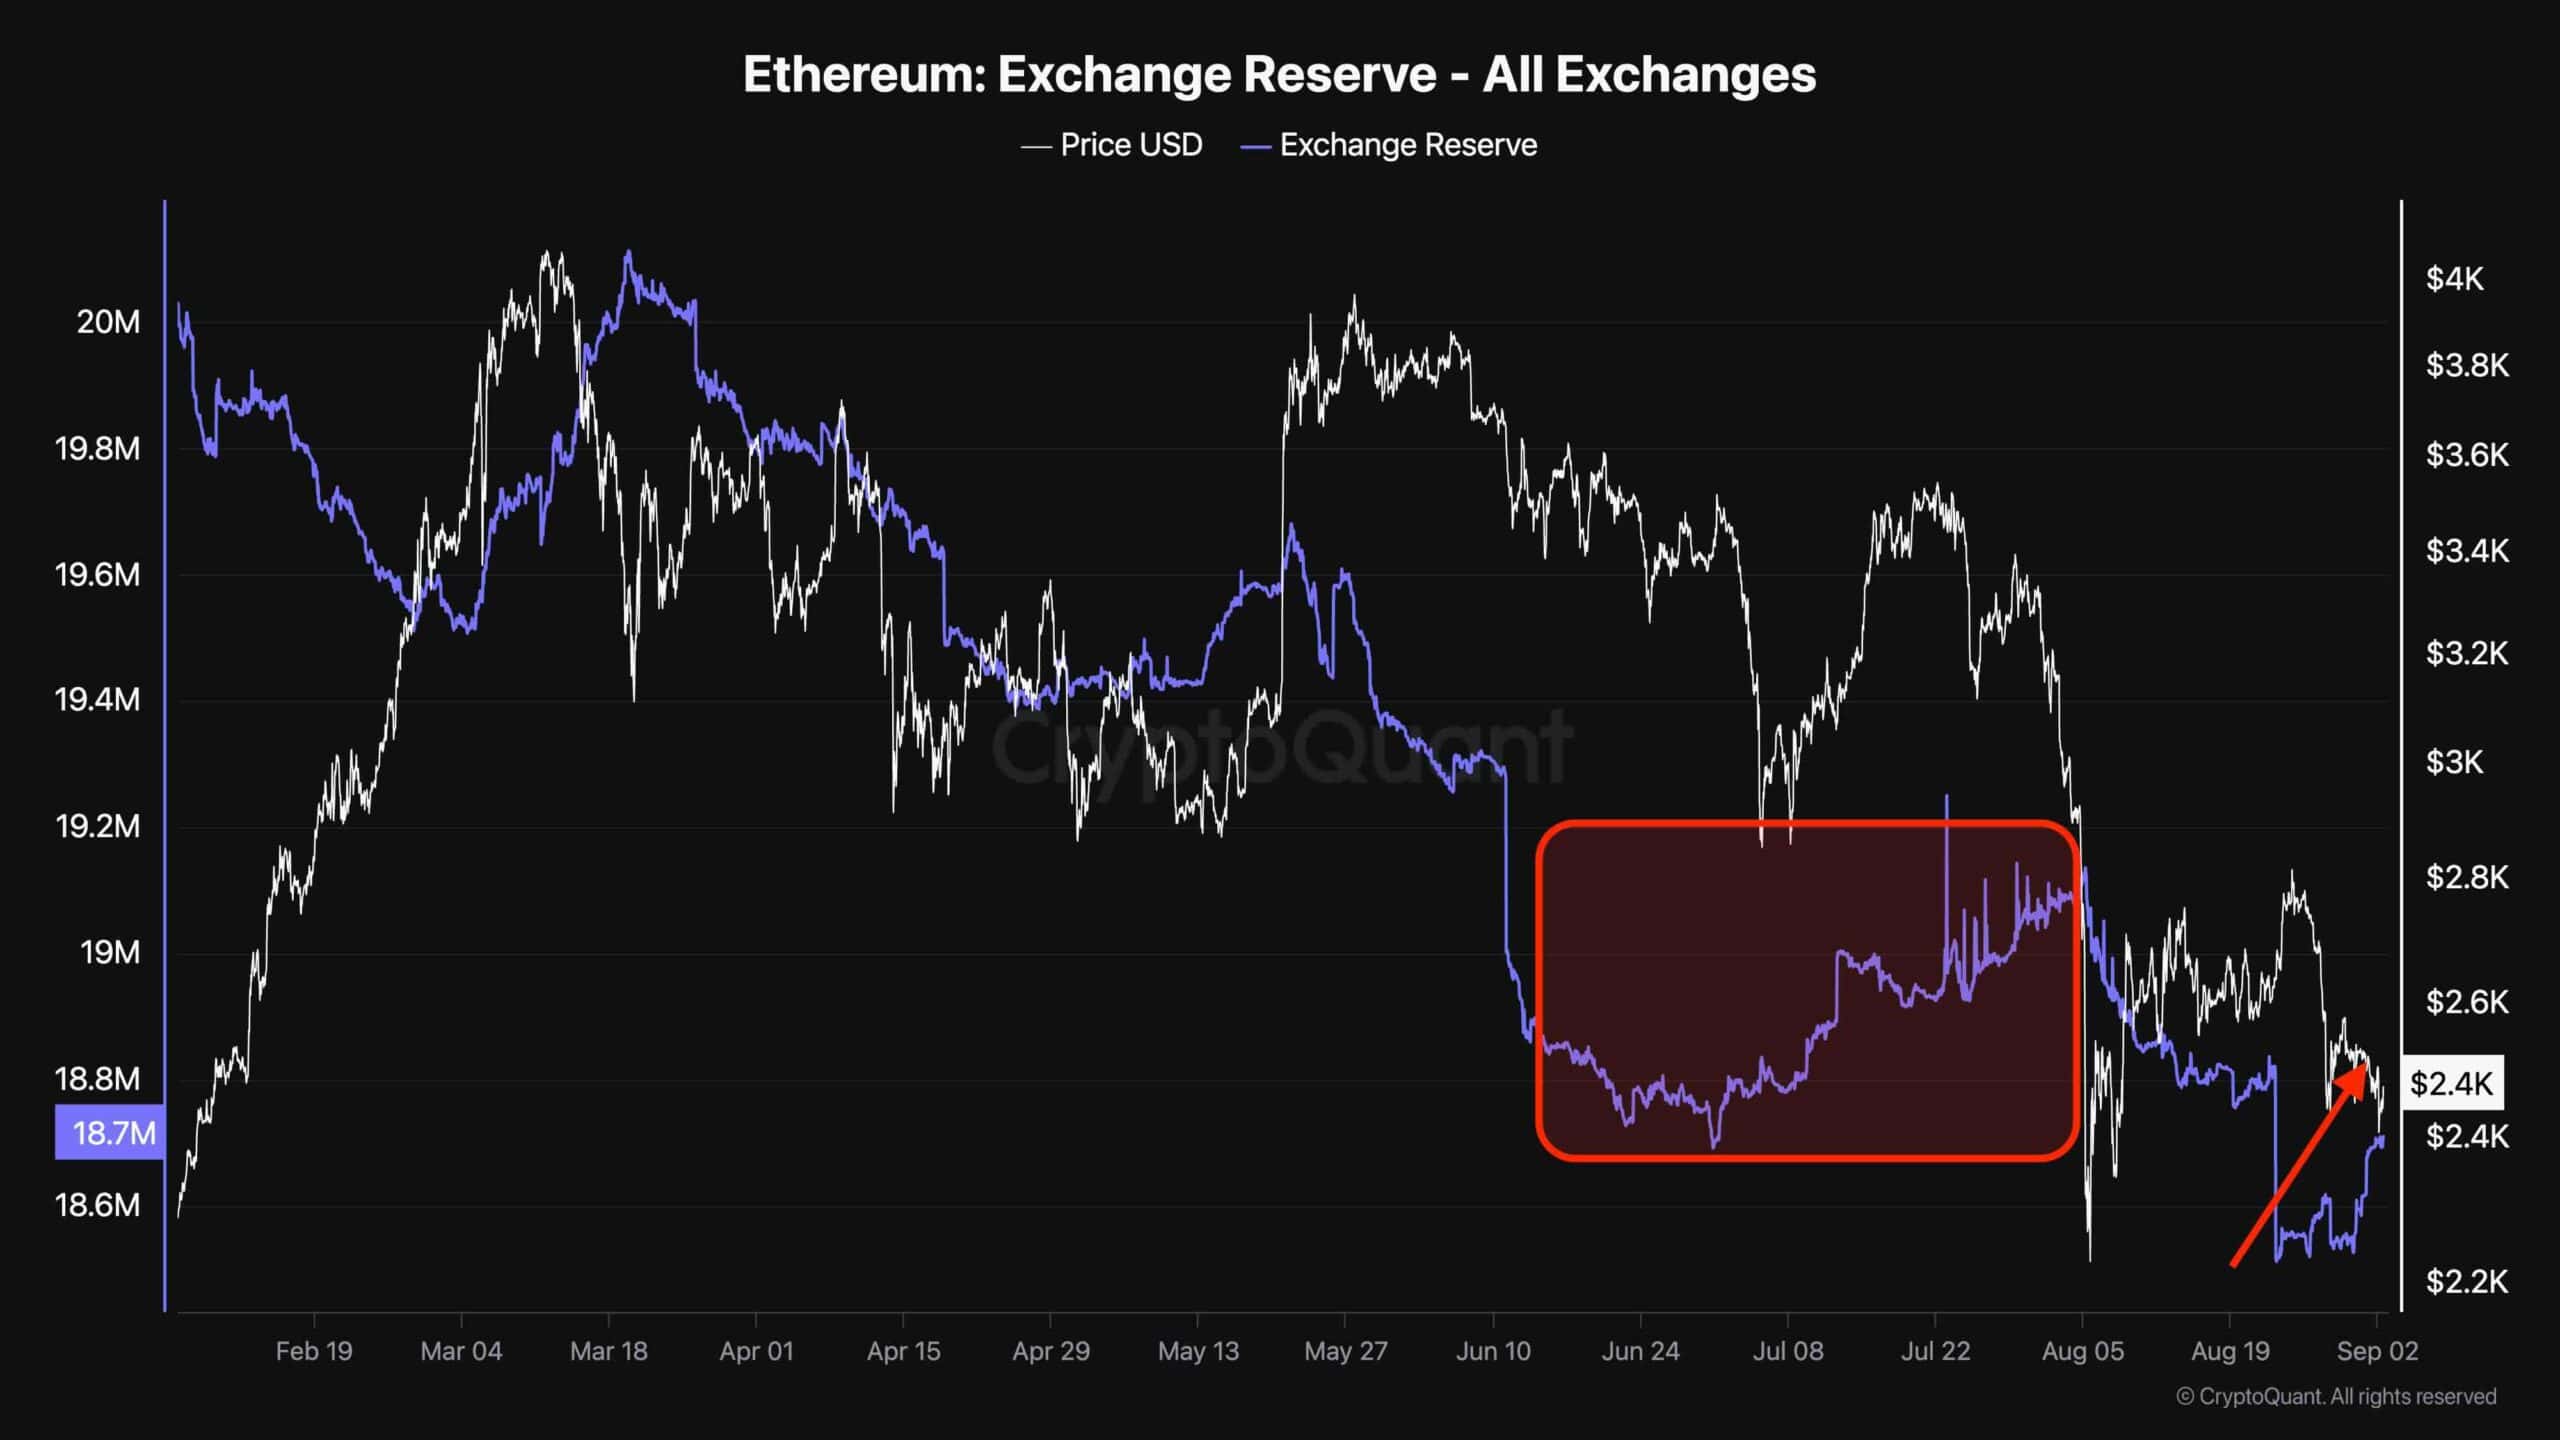
As ETH’s price has been experiencing a notable downtrend recently, traders are questioning whether the market is in an accumulation or distribution phase. The Ethereum Exchange Reserve metric, which tracks the amount of ETH held in exchange wallets, provides valuable insights into this question. Coins held on trading platforms are often considered a proxy for supply, as they can be quickly sold.
Between June and August, the metric trended upwards, signaling a distribution phase contributing to the ongoing bearish trend. Following the recent death cross, the Exchange Reserve metric is again rising sharply. This suggests that another distribution phase may be unfolding.
As Ethereum reserves on exchanges continue to grow, the likelihood of a decrease in demand and, consequently, a further price decline also increases. However, it’s important to consider the state of the futures market as well, as it plays a crucial role in determining price action and should be carefully analyzed before drawing any definitive conclusions.
The post Ethereum Price Analysis: Death Cross Formation Signals Potential ETH Drop to $2.1K appeared first on CryptoPotato.


