
The $7.5 significant resistance region recently halted Polkadot’s bullish momentum, resulting in a 12% decline.
Nevertheless, DOT’s price action hints at the continuation of the mid-term consolidation stage.
Technical Analysis
By Shayan
The Daily Chart
A detailed examination of Polkadot’s daily chart reveals an uncertain sentiment, with the price showcasing a prolonged period of sideways action within the range bounded by the $7.5 resistance and the $6.2 support, lacking clear momentum.
This consolidation stage indicates an equilibrium between buyers and sellers, confirmed by the RSI indicator hovering around the 50 mark.
Recently, the price faced rejection around the critical $7.5 resistance level and the significant 100-day moving average, leading to a notable decline.
However, in a broader context, the price will likely continue consolidating within the decisive range marked by the $7.5 resistance and the $6.2 support. A definitive breakout from this range is imperative to set the direction for a sustained trend.
The 4-Hour Chart
On the 4-hour chart, Polkadot’s price failed to reclaim the crucial resistance region defined by the 0.5 ($7.4) and 0.618 ($7.8) Fibonacci levels, leading to a notable rejection and initiating a bearish retracement towards the lower boundary of the ascending wedge at $7.
Upon reaching this decisive support threshold, the price encountered slight buying pressure and demand, resulting in a minor reversal. However, the momentum isn’t sufficient for the reversal to be valid.
As the price approaches a tight, narrow range marked by the wedge’s lower boundary and the 0.5 ($7.1) Fibonacci level, the upcoming price action will determine the next move. A breakout in either direction looks imminent.
Sentiment Analysis
By Shayan
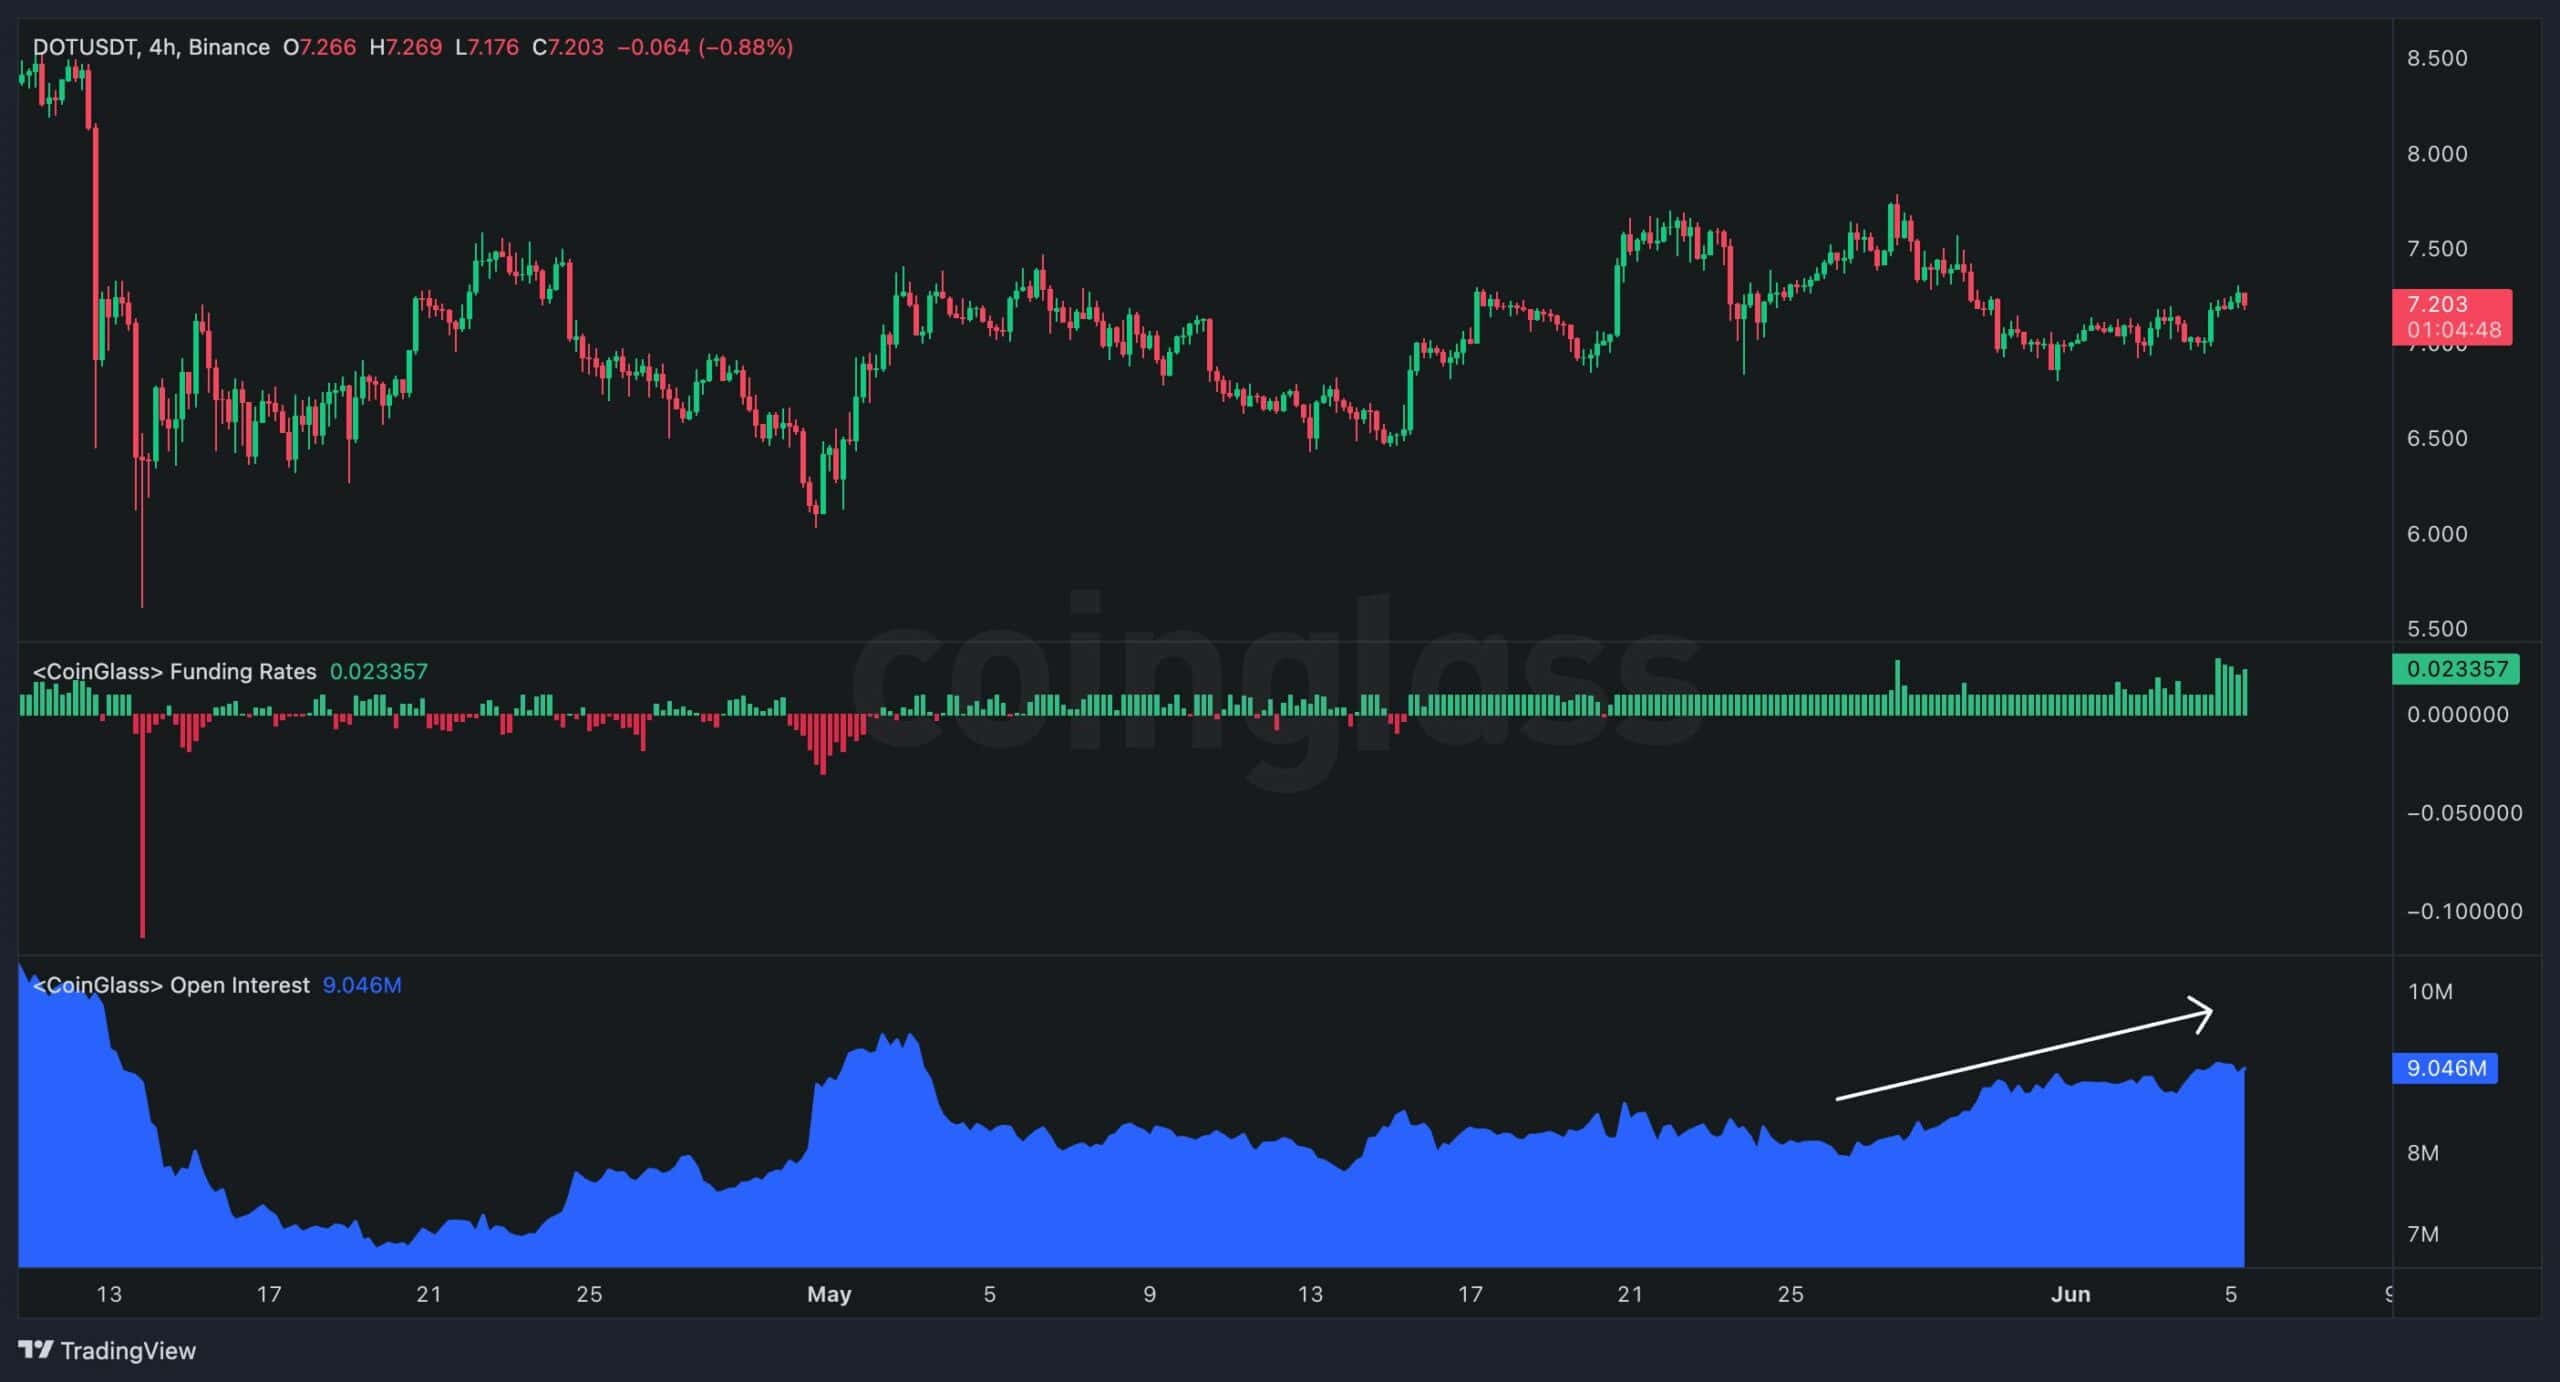
Analyzing the futures market metrics alongside Polkadot’s price fluctuations can provide valuable insights for traders. This chart demonstrates the Polkadot Funding Rates and Open Interest metrics, which measure whether buyers or sellers are executing their futures orders more aggressively, thereby assessing the futures market sentiment.
As the chart shows, during the recent prolonged consolidation stage, both metrics fluctuated near their lowest values, indicating a period of low activity and uncertainty. However, most recently, both the Funding Rates and Open Interest metrics have initiated a rise, suggesting heightened activity in the futures market.
The increase in these metrics indicates that long orders may become more aggressive, reflecting a shift in market sentiment towards a more bullish outlook. If this behavior continues, it could lead to a bullish trend, ultimately breaking Polkadot out of its prolonged and exhausting sideways range.
The post This Needs to Happen for DOT to Finally Break Above $8 (Polkadot Price Analysis) appeared first on CryptoPotato.


