

XRP price extended losses and traded below the $0.50 zone. The price tested the $0.4700 zone and is currently attempting a short-term recovery wave.
XRP is slowly moving higher from the $0.470 support.
The price is now trading below $0.4850 and the 100-hourly Simple Moving Average.
There was a break above a connecting bearish trend line with resistance at $0.480 on the hourly chart of the XRP/USD pair (data source from Kraken).
The pair could recover, but the bears might be active near the $0.4880 resistance.
XRP Price Finds Support
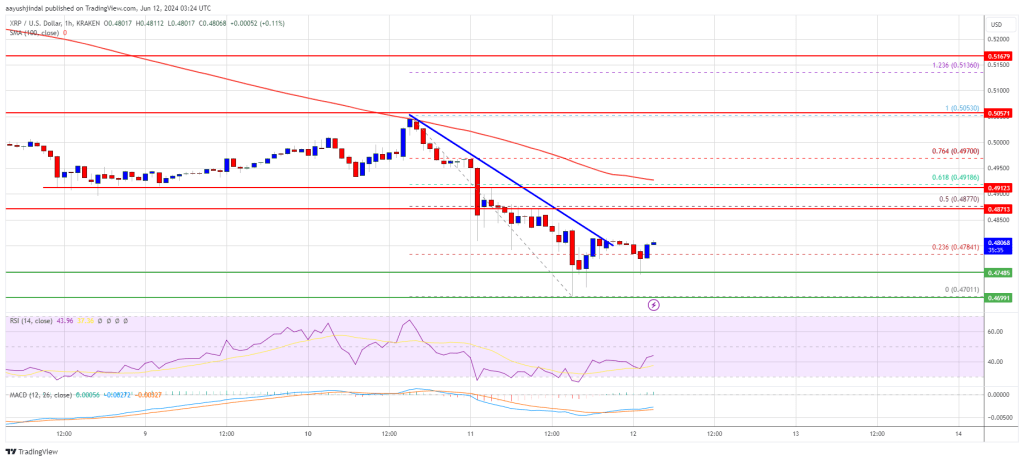
XRP price failed to recover above the $0.4880 resistance like Ethereum and Bitcoin. The price extended losses below the $0.480 level. It even tested the $0.470 zone. A low was formed at $0.4701 and the price is now eyeing a short-term recovery wave.
There was a move above the $0.4750 level. The price climbed above the 23.6% Fib retracement level of the downward move from the $0.5053 swing high to the $0.4701 low.
Besides, there was a break above a connecting bearish trend line with resistance at $0.480 on the hourly chart of the XRP/USD pair. However, it is still trading below $0.4850 and the 100-hourly Simple Moving Average.
On the upside, the price is facing resistance near the $0.4850 level. The first key resistance is near $0.4880 or the 50% Fib retracement level of the downward move from the $0.5053 swing high to the $0.4701 low. The next major resistance is near the $0.4920 level.
A close above the $0.4920 resistance zone could send the price higher. The next key resistance is near $0.50. If there is a close above the $0.50 resistance level, there could be a steady increase toward the $0.5050 resistance. Any more gains might send the price toward the $0.5250 resistance.
More Losses?
If XRP fails to clear the $0.4850 resistance zone, it could continue to move down. Initial support on the downside is near the $0.4750 level.
The next major support is at $0.470. If there is a downside break and a close below the $0.470 level, the price might accelerate lower. In the stated case, the price could decline and retest the $0.4550 support in the near term.
Technical Indicators
Hourly MACD – The MACD for XRP/USD is now losing pace in the bearish zone.
Hourly RSI (Relative Strength Index) – The RSI for XRP/USD is now below the 50 level.
Major Support Levels – $0.4750 and $0.4700.
Major Resistance Levels – $0.4850 and $0.4920.

