
Polkadot’s sideways consolidation stage has expanded, with the price confined between the significant resistance region of $7.4 and the crucial support zone of $6.4.
A valid breakout from this range is imperative for determining DOT’s upcoming trajectory.
Technical Analysis
By Shayan
The Daily Chart
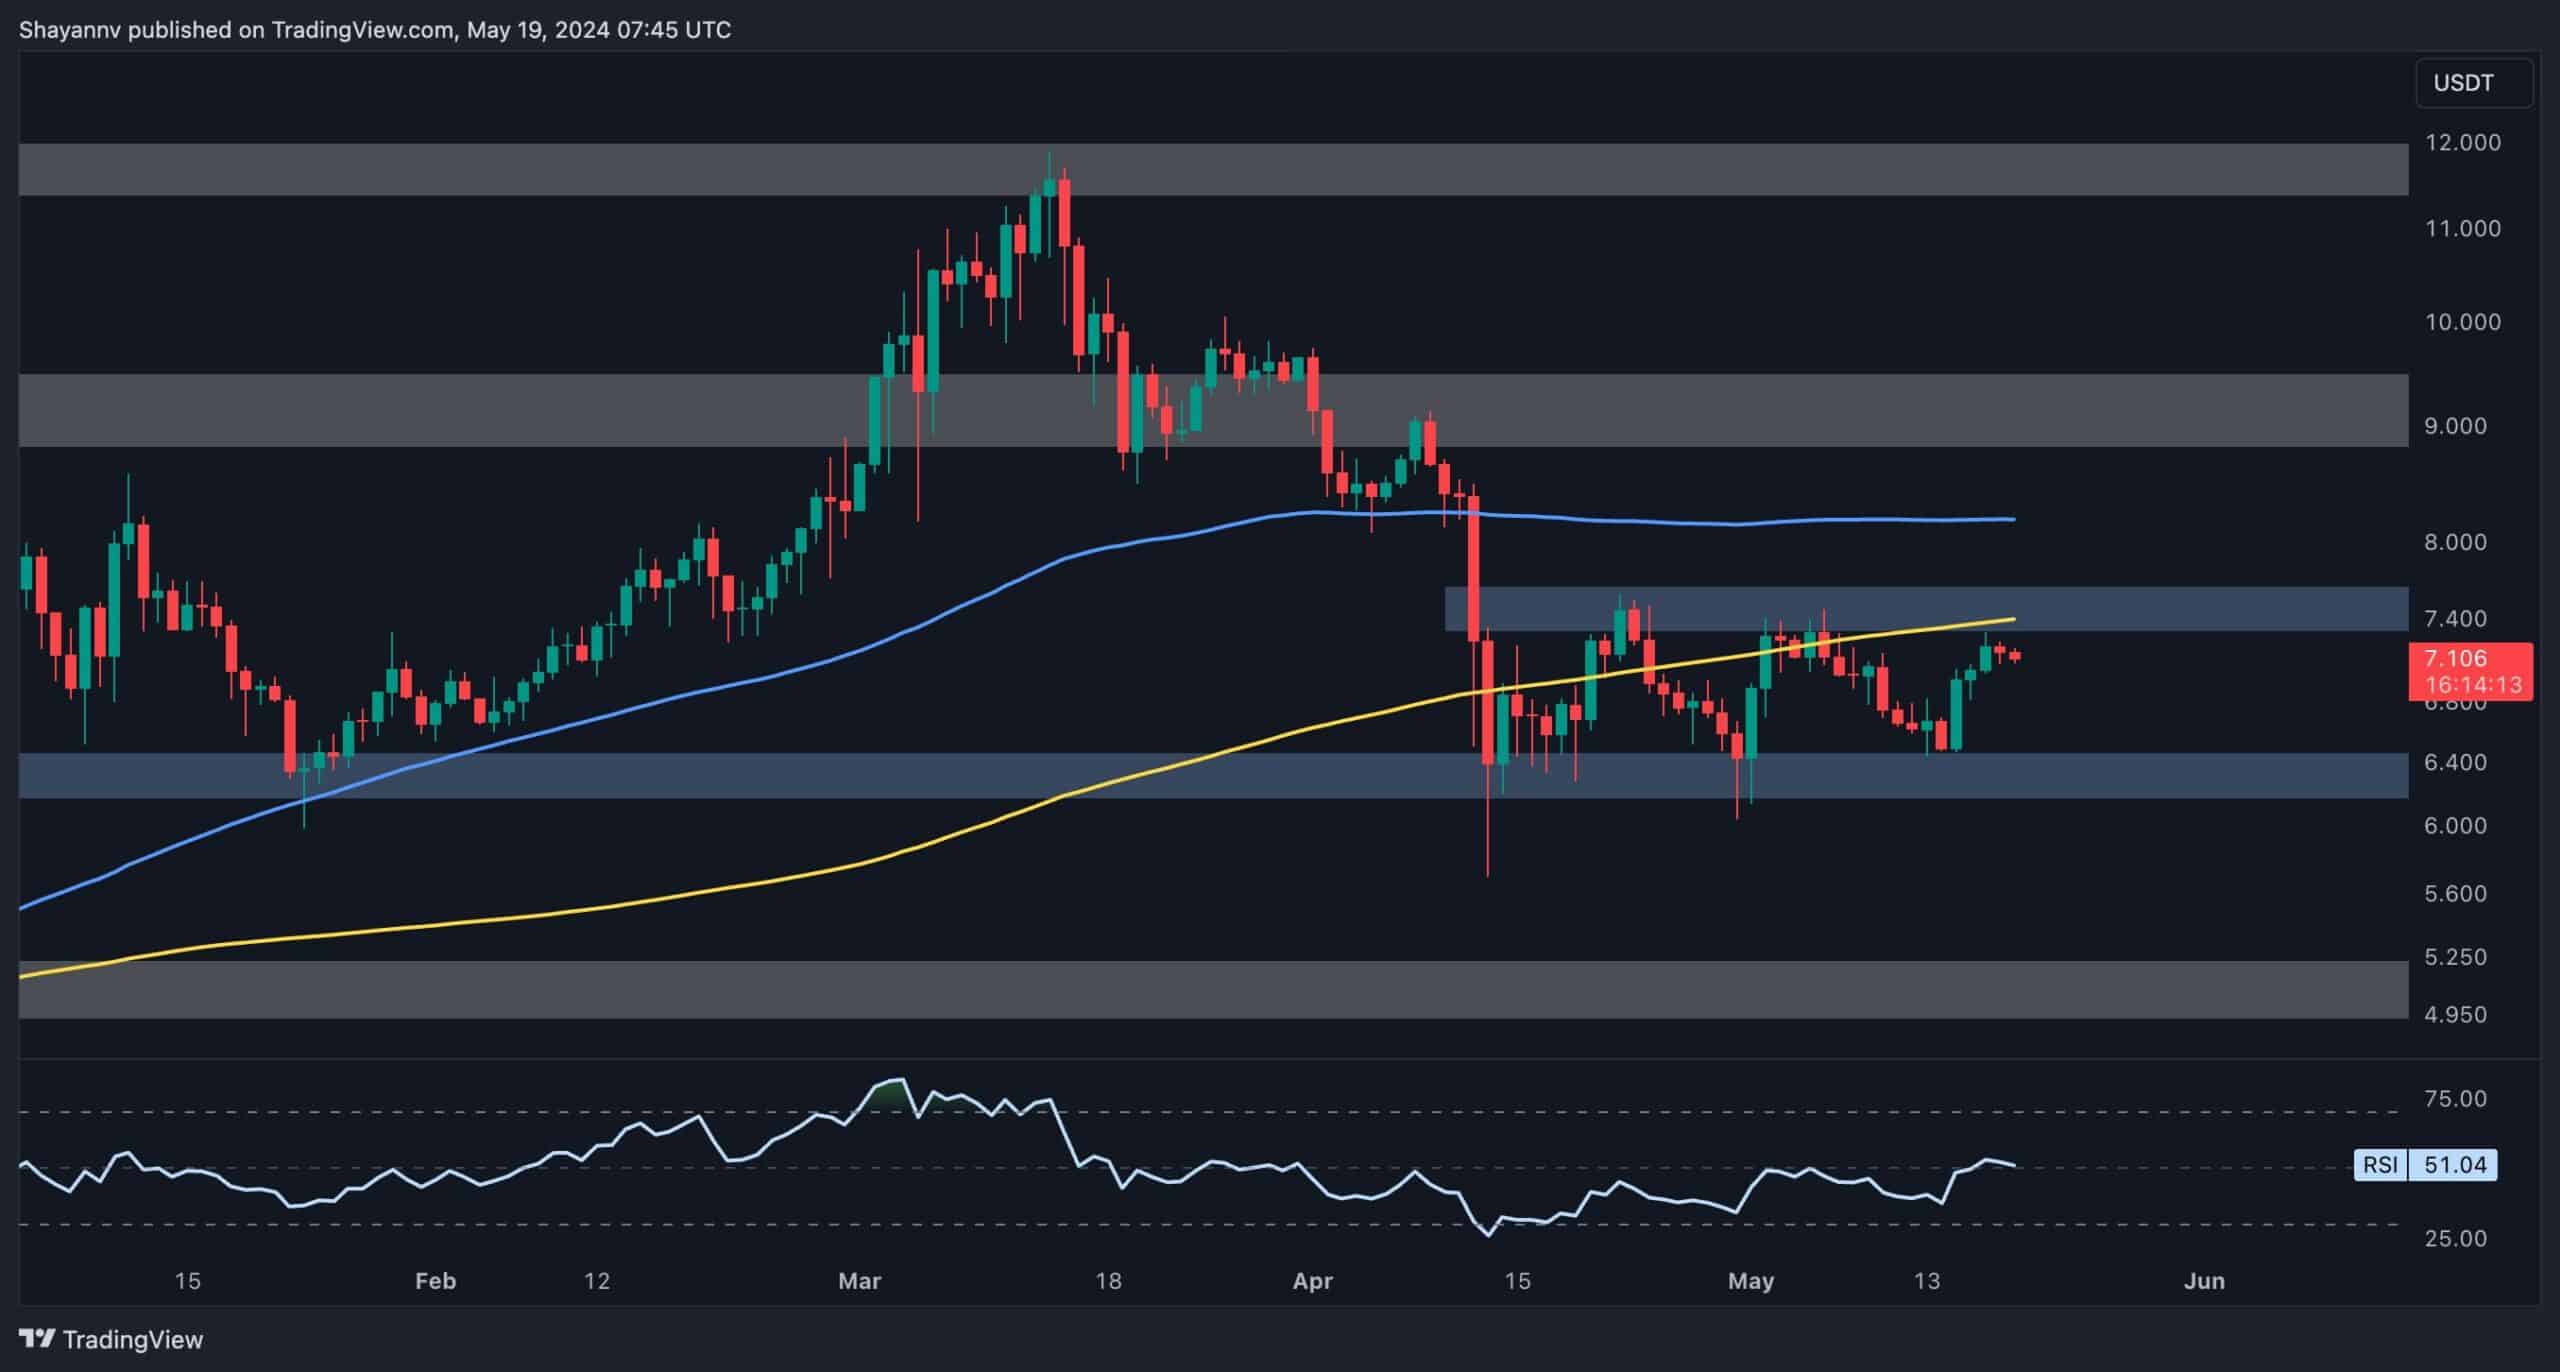
A thorough examination of Polkadot’s daily chart reveals an extended sideways consolidation phase, creating uncertainty in the market regarding DOT’s future direction.
The price is bounded by critical resistance at $7.5, which aligns with the significant 200-day moving average, and crucial support at $6.4.
Recently, DOT found support near the lower boundary of this range and rebounded significantly, reaching the upper threshold. If buyers can push the price above the $7.4 resistance and the 200-day MA, a sustained bullish trend could follow.
Conversely, if supply increases, a bearish reversal towards the lower boundary becomes feasible. The price action around this crucial resistance zone will dictate the cryptocurrency’s short-term trajectory.
The 4-Hour Chart
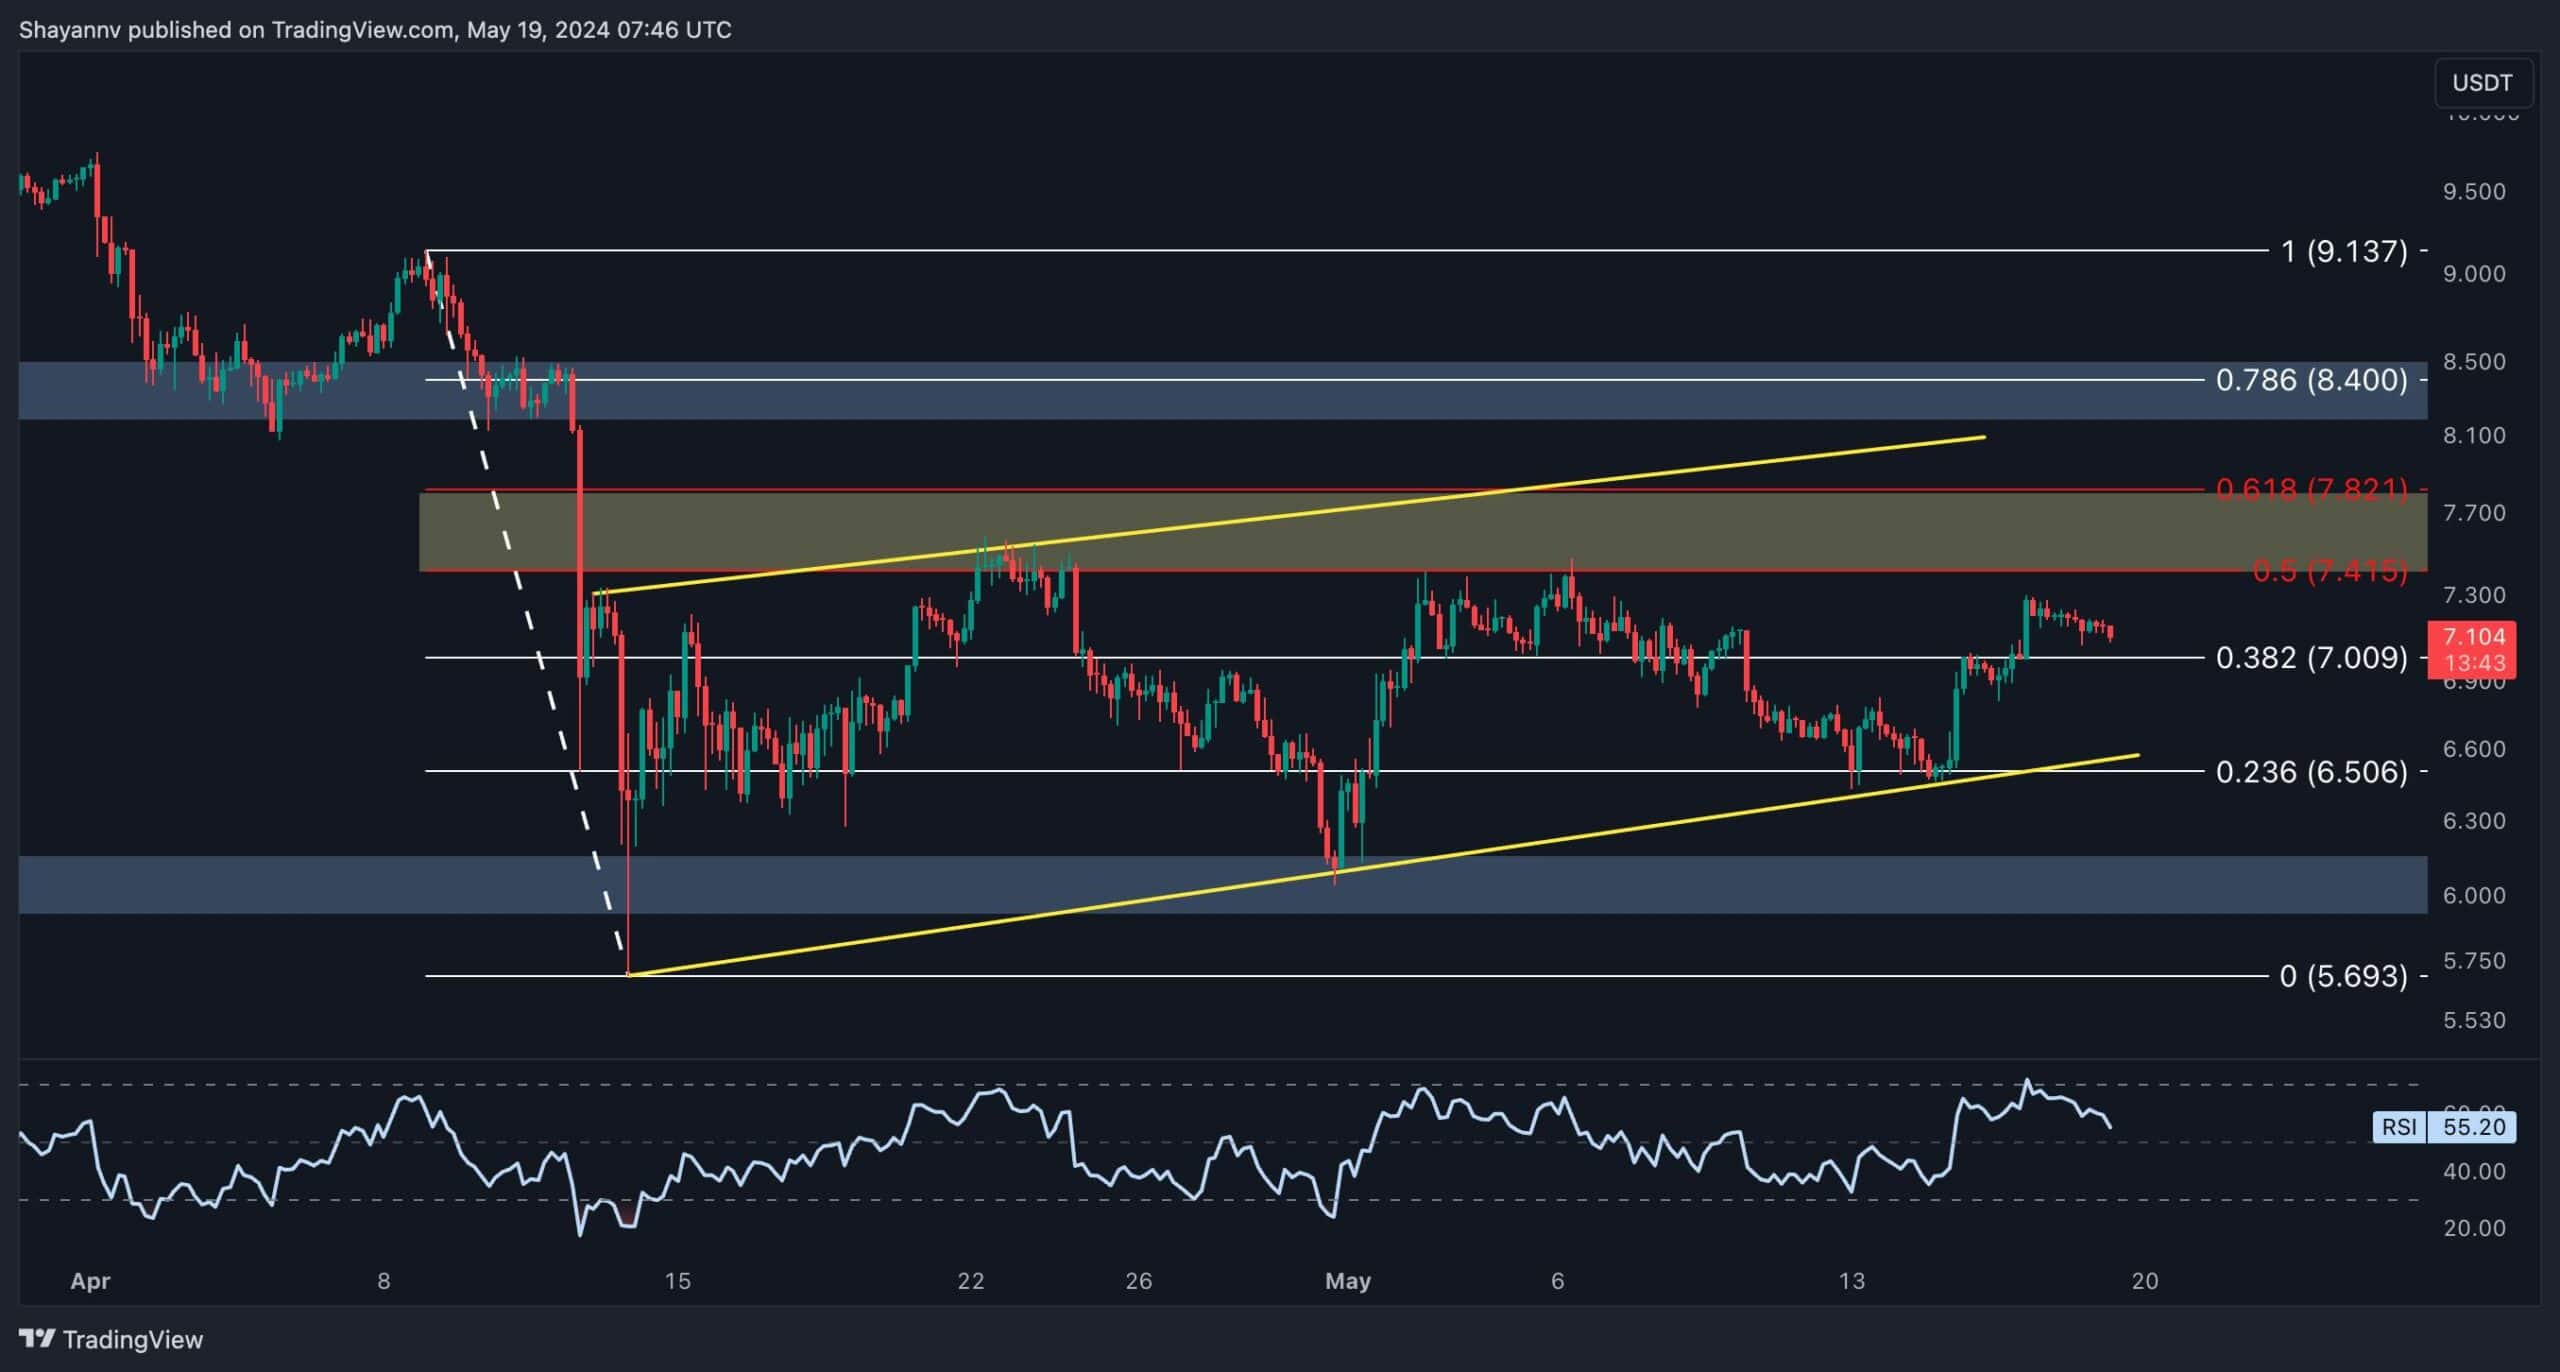
In the 4-hour timeframe, Polkadot fluctuated within an ascending wedge pattern for an extended period. Recently, the price found support near the wedge’s lower boundary. Following a resurgence in demand, DOT experienced a spike, retracing towards the crucial resistance region, which includes the 0.5 Fibonacci level.
This resistance has been a major barrier during the recent consolidation stage, halting upward momentum. If buyers manage to breach it, the next target will be the wedge’s upper boundary in the mid-term.
Conversely, a bearish reversal could lead to another downward move, aiming for the wedge’s lower boundary. A valid breakout from this pattern is required to determine the price’s upcoming direction.
Sentiment Analysis
By Shayan
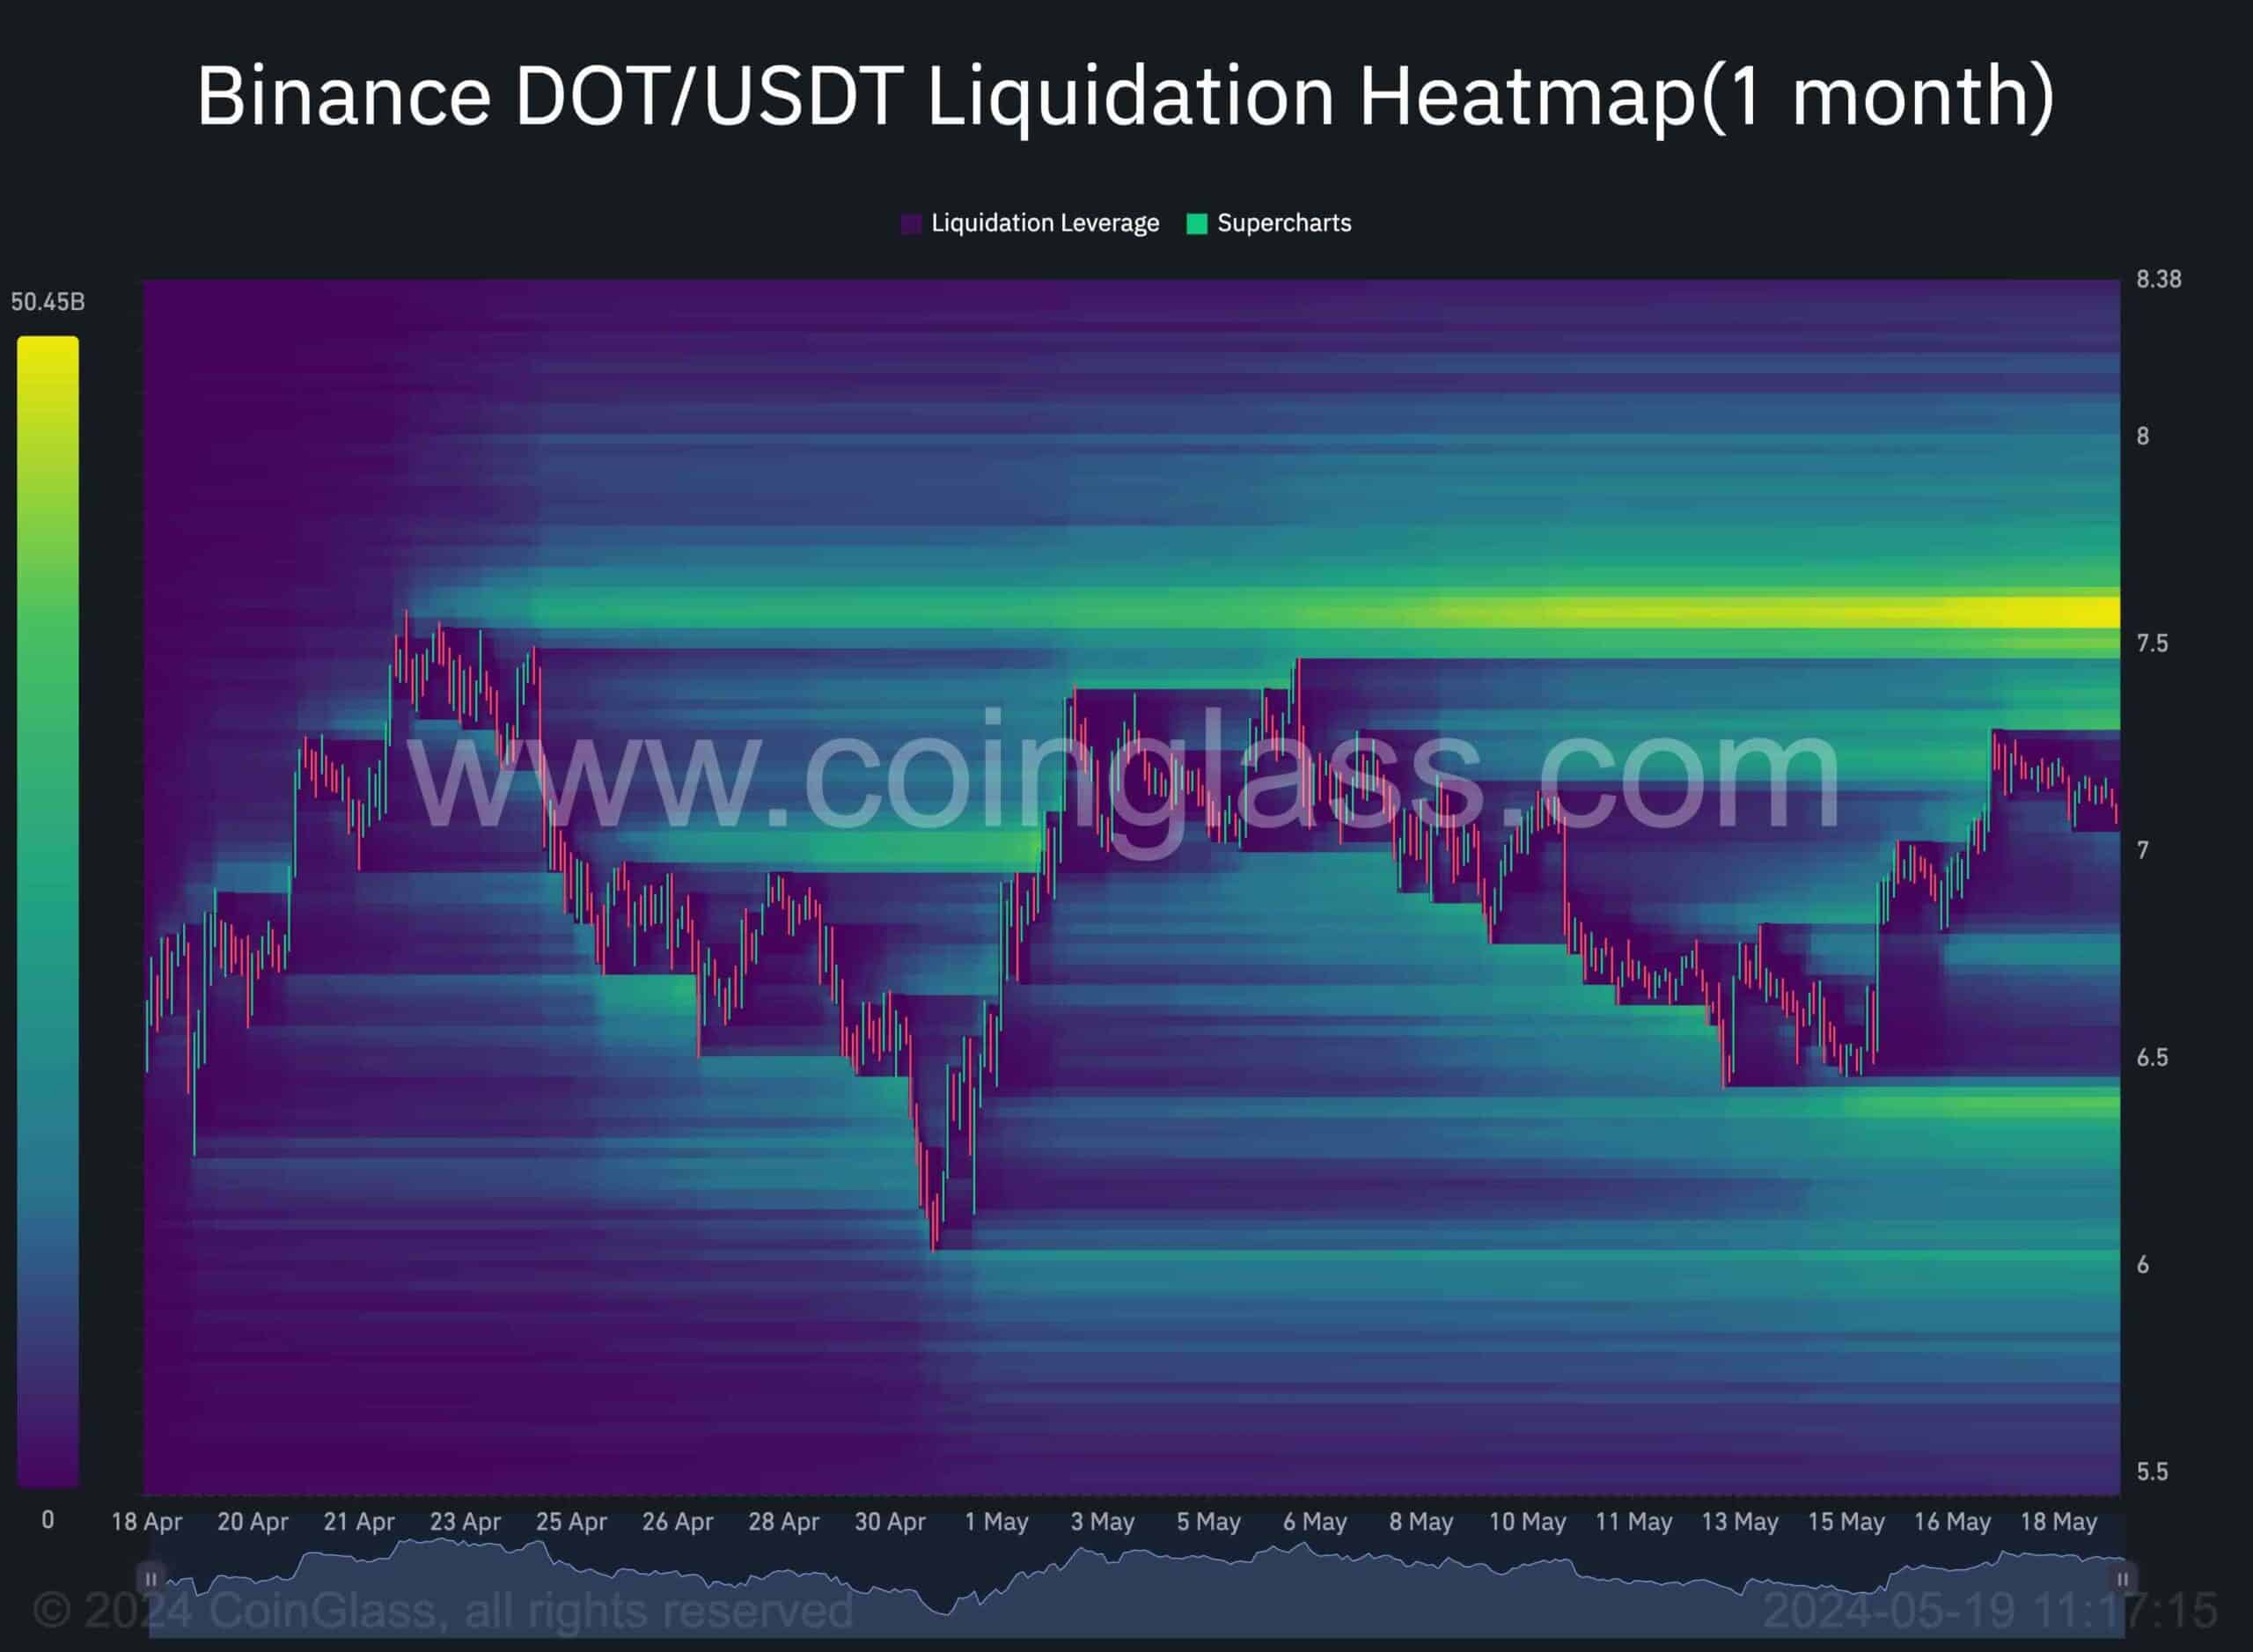
Amid uncertainty surrounding Polkadot’s price trajectory, it is crucial for market participants to analyze futures market sentiment to assess the cryptocurrency’s future potential. The accompanying chart illustrates the liquidation heatmap metric, highlighting where the most liquidity resides.
Upon analyzing the graph, it becomes evident that during a period of sideways consolidation, a significant amount of liquidity has formed above the range’s high of $7.5, consisting of numerous buy-stop orders. Consequently, Polkadot buyers may target this potential level of liquidity in the short term, possibly triggering a notable short-squeeze event.
However, closely examining the price action around this crucial juncture is essential for determining the cryptocurrency’s forthcoming direction. It is worth noting that a fake breakout could occur, aiming to clear the liquidity and cause a cascading effect, potentially manipulating the market.
The post Calm Before the Storm? DOT Price Looking Primed for a Breakout Following 4% Increase (Polkadot Price Analysis) appeared first on CryptoPotato.


