

Dogecoin extended losses and traded below the $0.1420 support zone against the US Dollar. DOGE is now recovering but facing key hurdles at $0.1450.
DOGE price tested the $0.1360 support and started a recovery wave.
The price is trading below the $0.1450 level and the 100 simple moving average (4 hours).
There is a key bearish trend line forming with resistance at $0.1430 on the 4-hour chart of the DOGE/USD pair (data source from Kraken).
The price must settle above $0.1450 to move into a positive zone and start a fresh surge.
Dogecoin Price Extends Losses
After a close below $0.150, Dogecoin price extended losses and moved into a short-term bearish zone, like Bitcoin and Ethereum. There was a drop below the $0.1450 support zone.
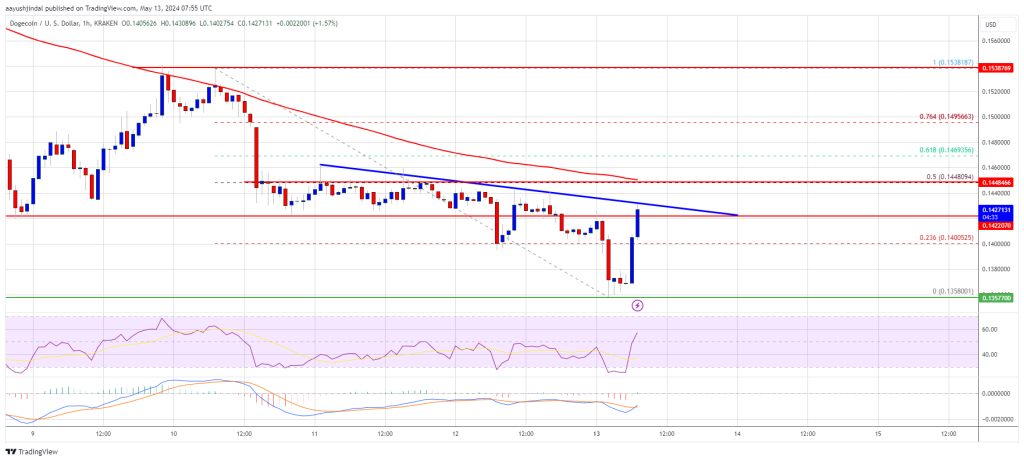
A low was formed at $0.1358 and DOGE is attempting a recovery wave. There was a minor increase above the $0.1420 resistance level. The price climbed above the 23.6% Fib retracement level of the downward move from the $0.1538 swing high to the $0.1358 low.
Dogecoin is still below the $0.1450 level and the 100 simple moving average (4 hours). On the upside, the price is facing resistance near the $0.1430 level. There is also a key bearish trend line forming with resistance at $0.1430 on the 4-hour chart of the DOGE/USD pair.
The next major resistance is near the $0.1450 level and the 100 simple moving average (4 hours). It coincides with the 50% Fib retracement level of the downward move from the $0.1538 swing high to the $0.1358 low.
Source: DOGEUSD on TradingView.com
A close above the $0.1450 resistance might send the price toward the $0.1535 resistance. Any more gains might send the price toward the $0.1620 level.
Another Decline In DOGE?
If DOGE’s price fails to gain pace above the $0.1450 level, it could start another decline. Initial support on the downside is near the $0.140 level.
The next major support is near the $0.1360 level. If there is a downside break below the $0.1360 support, the price could decline further. In the stated case, the price might decline toward the $0.1200 level.
Technical Indicators
4 Hours MACD – The MACD for DOGE/USD is now losing momentum in the bearish zone.
4 Hours RSI (Relative Strength Index) – The RSI for DOGE/USD is now above the 50 level.
Major Support Levels – $0.1400, $0.1360 and $0.1200.
Major Resistance Levels – $0.1430, $0.1450, and $0.1535.


