Problem Description
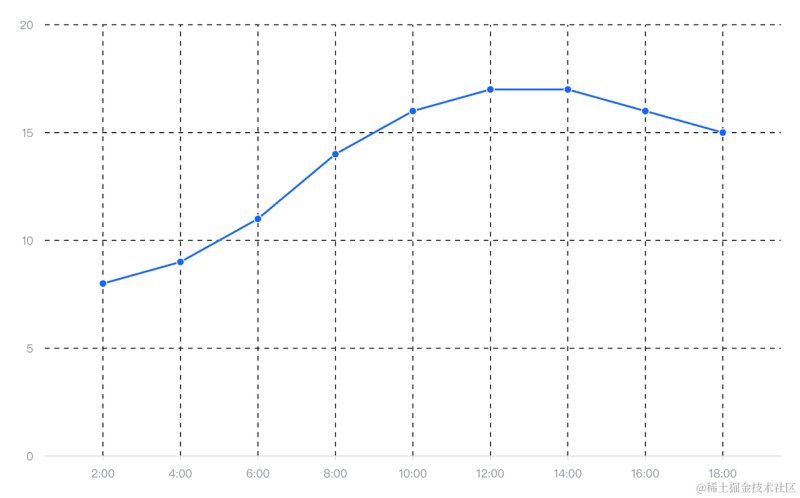
How to set the grid lines of the coordinate axis in VChart as dashed lines and adjust the style of the dashed lines?
Solution
In VChart, the configuration item for axis gridline style is axes[i].grid.style. You can adjust the solid line to the dashed line effect you want by configuring the lineDashproperty.
lineDashuses a set of values to specify the alternating length of lines and gaps that describe the pattern. For example:
lineDash: [2, 3];
lineDash: [0]; // solid line
lineDash: [0]; // solid line
Code Example
🔔 The following code can be copied and pasted into the editor to see the effect.
const spec = {
type: ‘line’,
data: {
values: [
{
time: ‘2:00’,
value: 8
},
{
time: ‘4:00’,
value: 9
},
{
time: ‘6:00’,
value: 11
},
{
time: ‘8:00’,
value: 14
},
{
time: ’10:00′,
value: 16
},
{
time: ’12:00′,
value: 17
},
{
time: ’14:00′,
value: 17
},
{
time: ’16:00′,
value: 16
},
{
time: ’18:00′,
value: 15
}
]
},
axes:[
{
orient:’left’,
grid:{
style:{
stroke:”black”,
lineDash:[5,5]
}
}
},
{
orient:’bottom’,
grid:{
visible: true,
style:{
stroke:”black”,
lineDash:[5,5]
}
}
}
],
xField: ‘time’,
yField: ‘value’
};
const vchart = new VChart(spec, { dom: CONTAINER_ID });
vchart.renderSync();
// Just for the convenience of console debugging, DO NOT COPY!
window[‘vchart’] = vchart;
Results
Quote