

XRP price is struggling to clear the $0.5120 resistance. The price could decline again in the near term if it stays below $0.5060 and $0.5120.
XRP is struggling to gain pace for a move above the $0.5120 level.
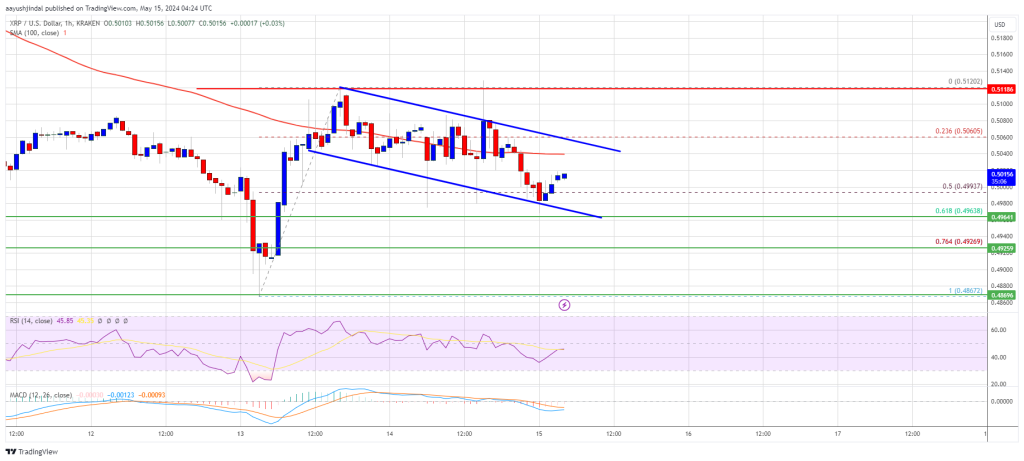
The price is now trading below $0.5050 and the 100-hourly Simple Moving Average.
There is a short-term declining channel forming with resistance at $0.5040 on the hourly chart of the XRP/USD pair (data source from Kraken).
The pair could start a decent increase if there is a close above the $0.5120 resistance.
XRP Price Stuck Near $0.50
Yesterday, we discussed how XRP price started a recovery wave, like Bitcoin and Ethereum. There was a move above the $0.4950 and $0.50 resistance levels.
The price even moved above $0.5100, but the bears were active near the $0.5120 resistance. A high was formed at $0.5120 and the price is now correcting gains. There was a move below the 50% Fib retracement level of the upward move from the $0.4865 swing low to the $0.5120 high.
The price is now trading below $0.5050 and the 100-hourly Simple Moving Average. However, the bulls are active above the 61.8% Fib retracement level of the upward move from the $0.4865 swing low to the $0.5120 high.
Immediate resistance is near the $0.5040 level and the 100-hourly Simple Moving Average. There is also a short-term declining channel forming with resistance at $0.5040 on the hourly chart of the XRP/USD pair. The first key resistance is near $0.5060. A close above the $0.5060 resistance zone could send the price higher.
The next key resistance is near $0.5120. If the bulls remain in action above the $0.5120 resistance level, there could be a rally toward the $0.5250 resistance. Any more gains might send the price toward the $0.5350 resistance.
More Losses?
If XRP fails to clear the $0.5040 resistance zone, it could continue to move down. Initial support on the downside is near the $0.4965 level. The next major support is at $0.4925.
If there is a downside break and a close below the $0.4925 level, the price might accelerate lower. In the stated case, the price could even drop below the $0.4865 support zone.
Technical Indicators
Hourly MACD – The MACD for XRP/USD is now losing pace in the bearish zone.
Hourly RSI (Relative Strength Index) – The RSI for XRP/USD is now below the 50 level.
Major Support Levels – $0.4965 and $0.4925.
Major Resistance Levels – $0.5040 and $0.5120.


