

XRP price is attempting a fresh increase above the $0.5050 resistance. The price could gain bullish momentum if it clears the $0.520 resistance.
XRP is eyeing a steady move above the $0.520 level.
The price is now trading above $0.5120 and the 100-hourly Simple Moving Average.
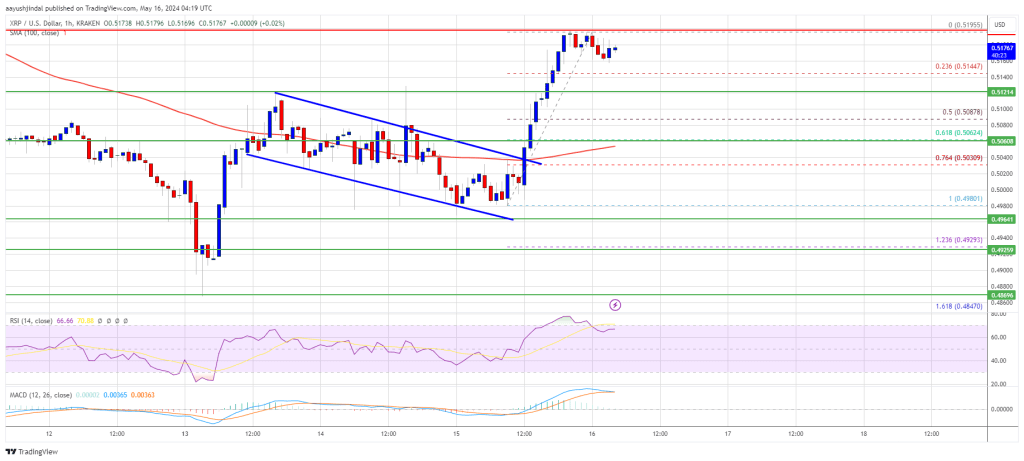
There was a break above a short-term declining channel with resistance at $0.5025 on the hourly chart of the XRP/USD pair (data source from Kraken).
The pair could start another increase if there is a close above the $0.520 resistance.
XRP Price Eyes Breakout
Yesterday, we saw how XRP price started a recovery wave, like Bitcoin and Ethereum. The price was able to settle above the $0.4950 and $0.50 resistance levels.
There was a break above a short-term declining channel with resistance at $0.5025 on the hourly chart of the XRP/USD pair. The pair even cleared the $0.5150 resistance level and settled above the 100-hourly Simple Moving Average.
It traded as high as $0.5195 and is currently consolidating gains above the 23.6% Fib retracement level of the upward move from the $0.4980 swing low to the $0.5195 high. The price is also trading above $0.5120 and the 100-hourly Simple Moving Average.
Immediate resistance is near the $0.5185 level. The first key resistance is near $0.5200. A close above the $0.5200 resistance zone could send the price higher. The next key resistance is near $0.5220. If the bulls remain in action above the $0.5220 resistance level, there could be a rally toward the $0.5350 resistance. Any more gains might send the price toward the $0.550 resistance.
Another Decline?
If XRP fails to clear the $0.520 resistance zone, it could start another decline. Initial support on the downside is near the $0.5145 level. The next major support is at $0.5120.
If there is a downside break and a close below the $0.5120 level, the price might accelerate lower. In the stated case, the price could even drop below the $0.5050 support zone or the 61.8% Fib retracement level of the upward move from the $0.4980 swing low to the $0.5195 high.
Technical Indicators
Hourly MACD – The MACD for XRP/USD is now losing pace in the bullish zone.
Hourly RSI (Relative Strength Index) – The RSI for XRP/USD is now above the 50 level.
Major Support Levels – $0.5120 and $0.5050.
Major Resistance Levels – $0.5200 and $0.5220.


