
A recent rejection from Polkadot’s 200-day moving average has sparked a significant downturn, bringing the cryptocurrency’s price closer to the lower boundary of its sideways trading range, marked at $6.
However, the price action near this juncture holds paramount importance in predicting the cryptocurrency’s next move.
Technical Analysis
By Shayan
The Daily Chart
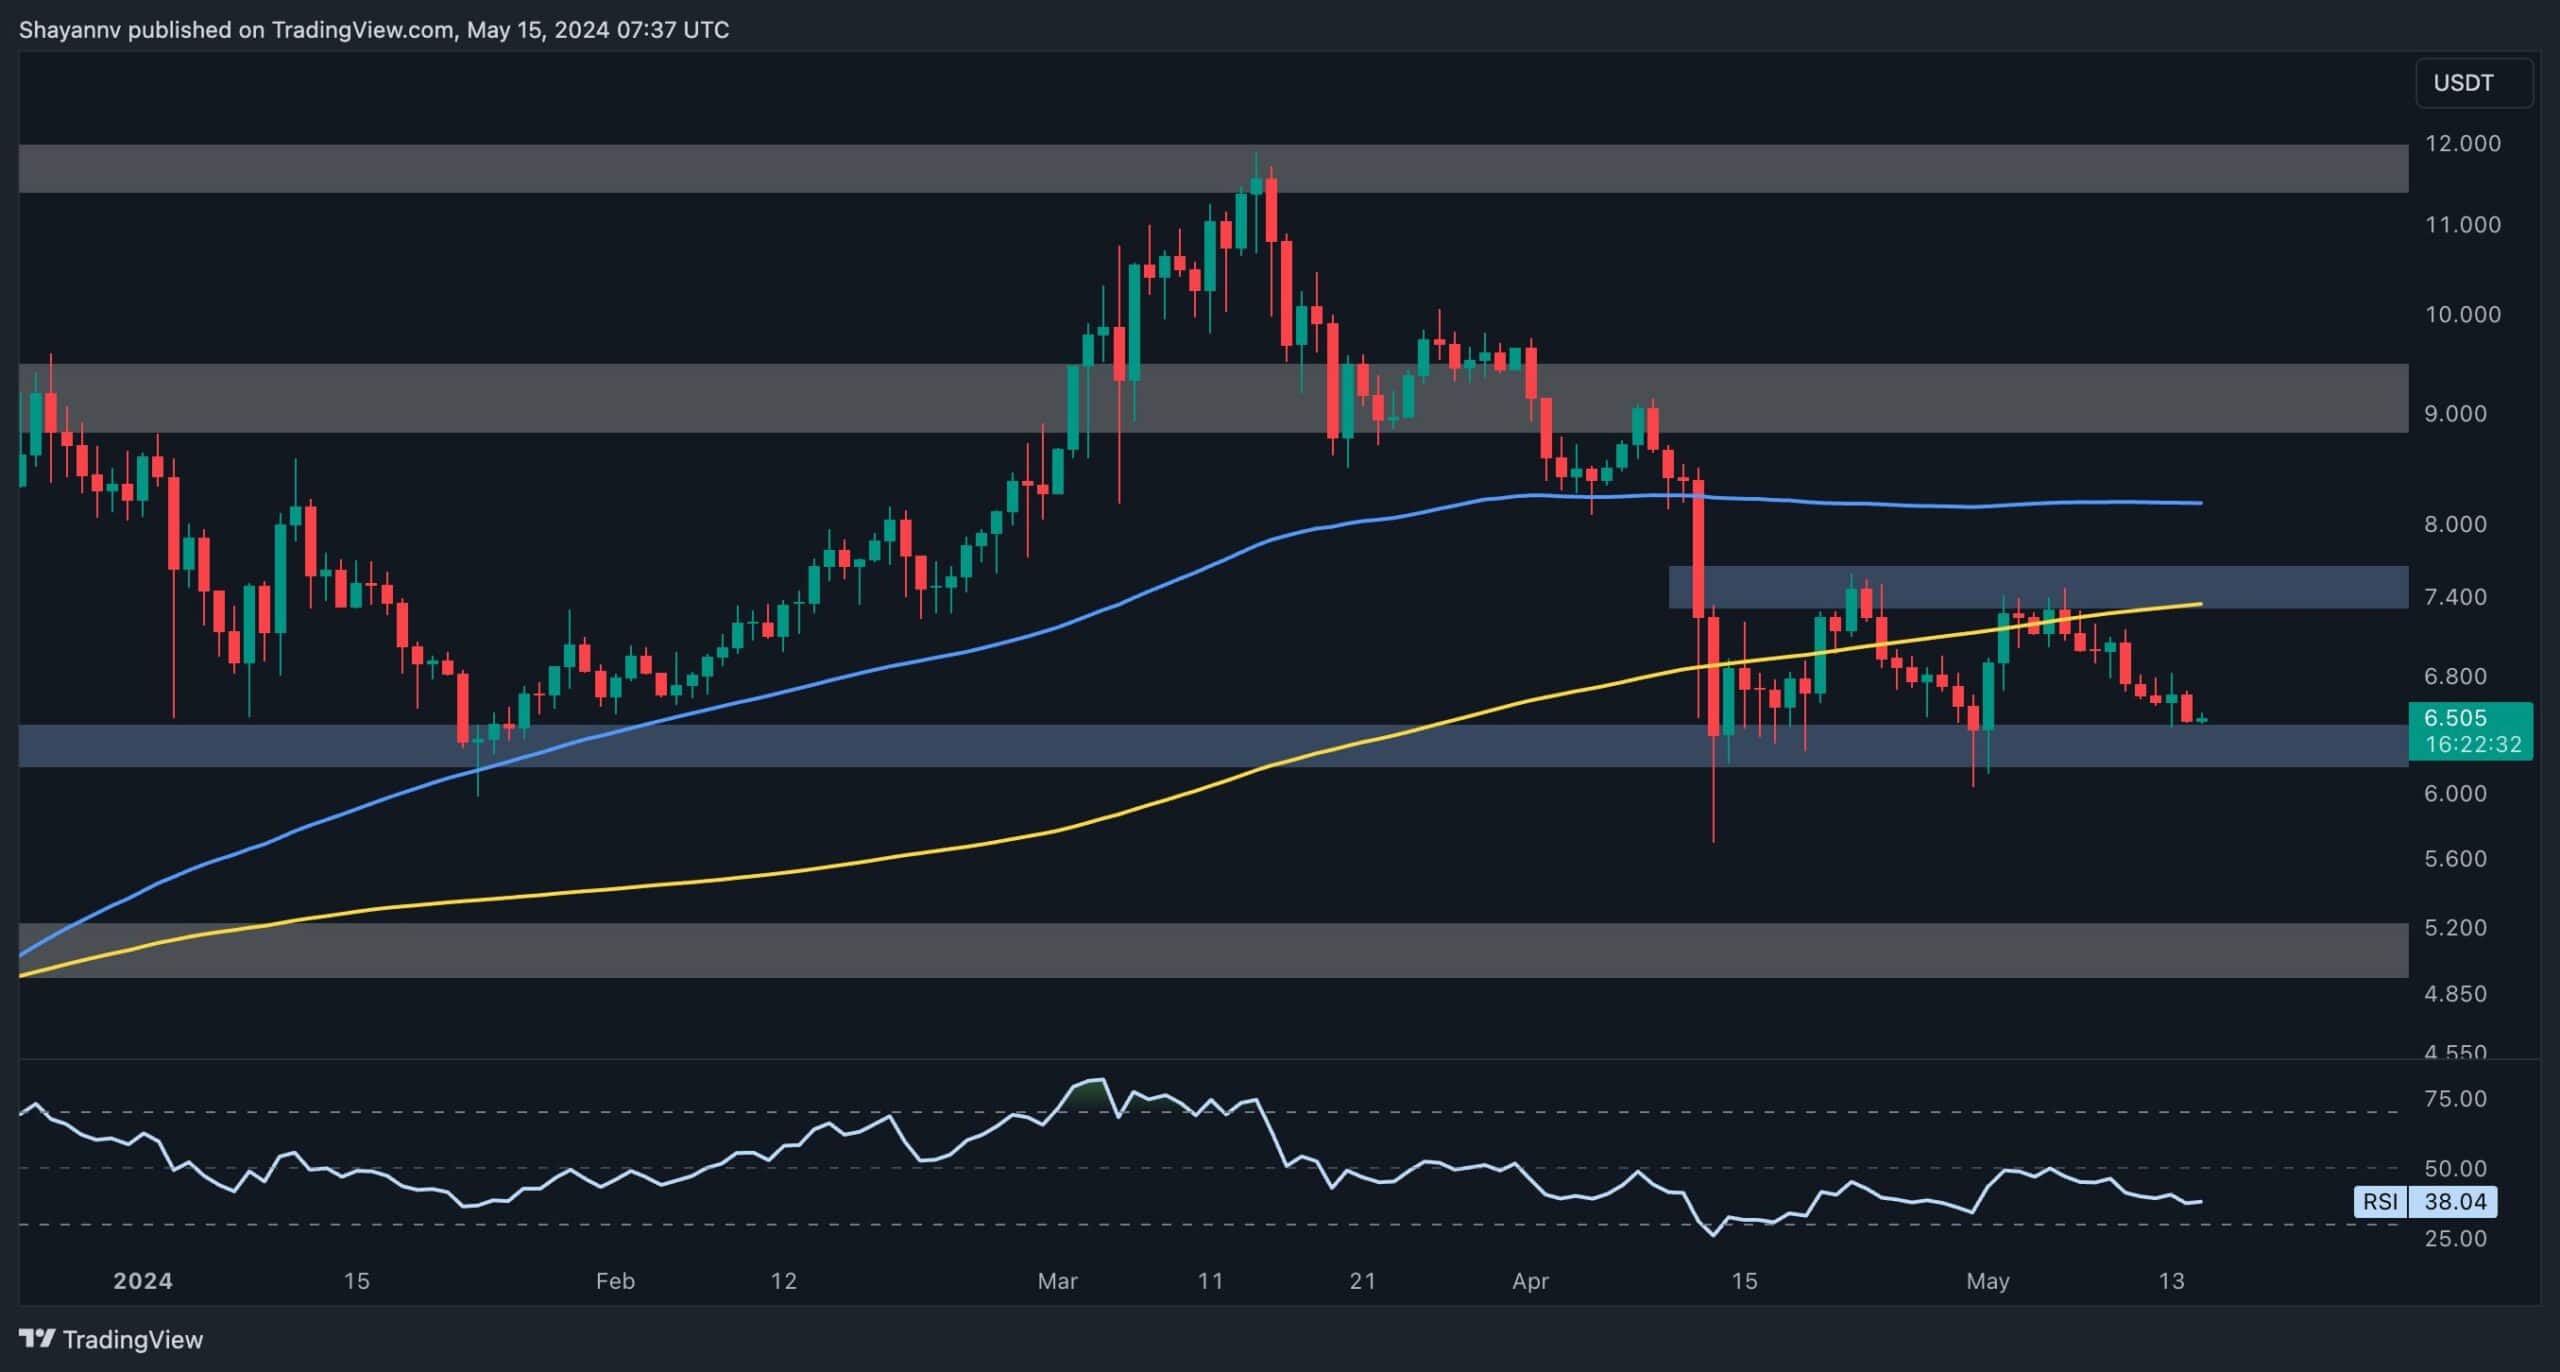
A thorough examination of Polkadot’s daily chart reveals a prolonged sideways consolidation phase, with crucial resistance at $7.5, coinciding with the significant 200-day moving average and critical support at $6. Recently, the price encountered rejection near the upper boundary of this range, resulting in a notable decline.
As the cryptocurrency now approaches the lower boundary of the range, sellers are poised for a potential bearish breakout.
Should they succeed in pushing the price below this critical level, a sustained bearish trend could ensue. Conversely, a bullish rebound towards the upper boundary of the range becomes feasible with an influx of demand. Yet, the price action around this vital support zone will dictate the cryptocurrency’s near-term trajectory.
The 4-Hour Chart
Zooming in on the 4-hour timeframe, following rejection from significant resistance around the $7.4 mark, which encompasses the 0.5 Fibonacci level and the upper boundary of an ascending wedge, the price experienced a sharp decline, nearing the wedge’s lower limit.
However, Polkadot is now teetering on the edge of breaking below this crucial demand zone, hinting at a potential fresh bearish momentum.
Despite this, considerable demand near this key level leaves room for a bullish rebound, potentially leading to a retracement towards the pattern’s upper trendline. Nonetheless, if the price ultimately breaches the lower boundary of the pattern, sellers will target the range’s lower threshold at $6.
Sentiment Analysis
By Shayan
Given the recent uncertainty surrounding Polkadot’s price trajectory, it’s vital for participants to delve into futures market sentiment to gauge the cryptocurrency’s future potential. The accompanying chart illustrates key metrics such as Open Interest and Funding Rates in conjunction with Polkadot’s daily price movements.
Upon analyzing the graph, it becomes apparent that simultaneous with a period of sideways consolidation, both Open Interest (OI) and funding rates have significantly decreased, fluctuating near their lowest points.
The notable decline in both metrics suggests that the futures market may be ripe for aggressive futures positioning, possibly triggering a substantial market shift.
Thus, if the ongoing consolidation phase culminates in heightened demand and an influx of long positions, it could signal the start of a noteworthy bullish trend, with eyes set on higher price targets. On the other hand, if the current steady price action results in the reinstallation of short positions, a cascade will be the most probable outcome.
The post Here’s How Low DOT’s Price Might Crash if $6 Support Fails (Polkadot Price Analysis) appeared first on CryptoPotato.


