
I used the hyperfine tool to measure the overhead of startup and shutdown of several code interpreters. Each interpreter was invoked with an empty string for evaluation. In few cases it was not possible, an empty file was passed as argument.
This is more of a interesting experiment and presentation of hyperfine utility, and its plotting capabilities rather than a serious benchmark. The results should not be taken as an indication of “X is faster than Y”.
Here’s the link to the repo with the code:
Hyperfine
Hyperfine is command-line benchmarking tool. It reruns the given commands multiple times and does statistical analysis. It can export measurements to various file formats like csv, JSON, markdown, etc. Those results can be then used as an input for a bunch of included scripts (e.g. to draw a plot).
Basically, it does all the hard part, so that you don’t have to.
Check out the official hyperfine Github repo
Here’s the command I used to do measurements:
-N tells hyperfine to not use shell for launching commands. It’s not needed in my case, because I’m launching binaries.
–warmup 1 performs one run of each command before doing actual measurements.
–export-csv 1.csv exports summary to csv file.
–export-json 1.json expoorts measurements data to JSON file. This is needed to plot the results.
Other useful options include:
–min-runs performs at least n runs for each command.
–runs performs exactly n runs for each command.
–parameter-list lets you execute parametric runs.
Plotting the results
Hyperfine comes with a Python script that generates a box plot of the measurements.
It requires the measurement data to be exported as JSON, which is used as the input file.
I made some minor improvements to the script to better suit my needs.
If you’re not familiar with box plot, you can read e.g. How to interpret the result of a box plot?
Interpreters
I used the following code interpreters:
LuaJIT 2.1.1702233742
GNU bash, version 5.2.26(1)-release
zsh 5.9
dash 0.5.12-1
fish, version 3.7.0
GNU Awk 5.3.0
perl 5, version 38, subversion 2 (v5.38.2)
ruby 3.0.6p216
Python 3.11.8
PHP 8.3.3
JavaScript-C60.9.0
JavaScript-C78.15.0
guile (GNU Guile) 3.0.9
CHICKEN Version 5.3.0 (rev e31bbee5)
Erlang/OTP 26 [erts-14.2.2]
julia version 1.10.2
The OCaml toplevel, version 5.1.0
SWI-Prolog version 9.0.4
(GNU Prolog) 1.5.0
scryer-prolog “c8bf0be”
Poly/ML 5.9.1 Release
R version 4.3.3
tcl 8.6.14-1
cbqn r1646.49c0d9a-1
Results
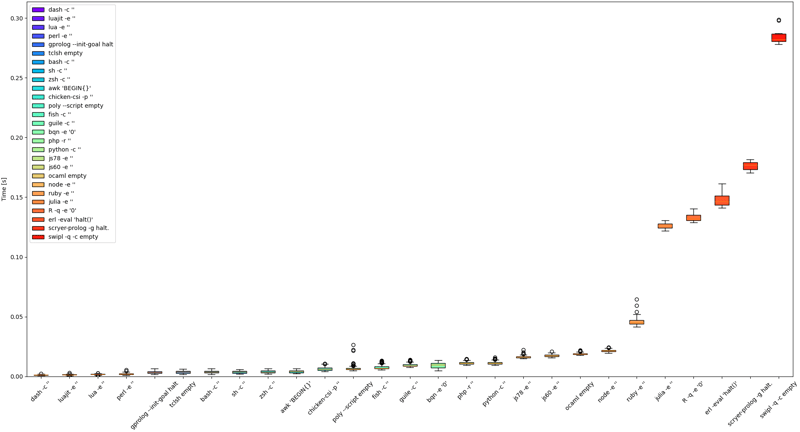
The results of the box plot are sorted by median time.
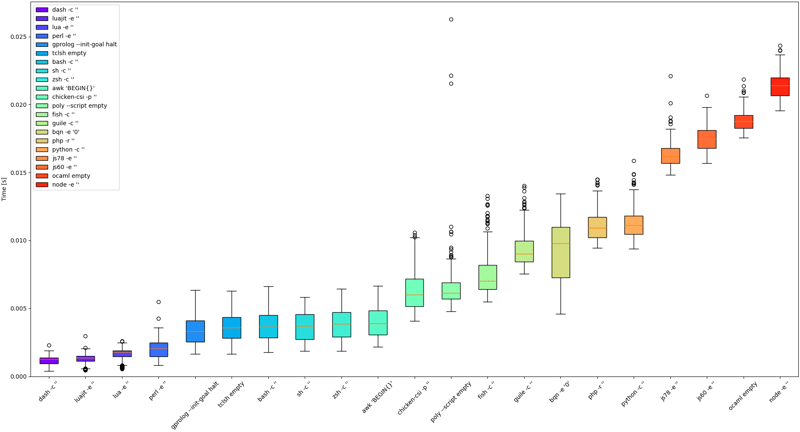
Here’s the results without the slowest ones:
Some insights:
dash, luajit and lua have the smallest overhead.
perl is right next. It’s actually fascinating that its overhead is smaller than that of shells considering their usage for scripting.
The next group are tclsh, awk, sh, bash, zsh and gprolog. Two surprising things here. First, I did not expect awk to have bigger overhead than perl, considering it’s much smaller and more frequently used for small scripts. Second, I did not expect language like prolog to even be here (Especially looking at results of other prolog implementation). I’d think that such higher level, more complex languages often have bigger startup/shutdown overhead.
Past this point, the results are much more varied.
The next comes chicken scheme, polyml and fish. Fish has somewhat bigger overhead than other shells. That shouldn’t matter though, because it’s more focused on interactive use. You should still write your shell scripts in /bin/sh (or /usr/bin/env bash).
The next is guile scheme and bqn, which has the biggest span of the measurements so far.
After that there’s php and python.
Then there’s a small gap and there’s spider monkey (js78 and js60).
After that ocaml and then node. A bit surprising that SpiderMonkey gets better results here than node.
Then there’s a big jump for ruby. It’s quite surprising, because I’d expect it to be closer to python/php.
Then there’s even bigger gap and we get julia, R, erlang and scryer-prolog
We finish with another big jump and last result, which is swi-prolog
I tried to add clojure, but its overhead was twice that of swi-prolog, which is probably expected. Java is known to not be fastest one when it comes to startup.
Note that I was running this on my personal machine. Some interpreters read configuration file, while others do not. This adds to the overhead. For more reliable results, it should be run in a separate, clean namespace.
Conclusions
hyperfine is cool. It does all the hard work and comes with a script to visualise the results. You should use it for your projects.
No definitive conclusions should be made from the measurements themselves, because in most cases the overhead of startup and shutdown doesn’t matter. It only applies if you have really tiny script that is run huge number of times. If you really do then maybe dash, lua or perl would be a good choice, or maybe not, please measure.

