

Bitcoin price found support at $61,800 and recovered higher. BTC jumped to $64,500 and is currently consolidating gains above $63,500.
Bitcoin started another increase after it found support near the $61,800 zone.
The price is trading above $63,500 and the 100 hourly Simple moving average.
There was a break above a key bearish trend line with resistance at $63,250 on the hourly chart of the BTC/USD pair (data feed from Kraken).
The pair must stay above the $63,200 support zone to continue higher in the near term.
Bitcoin Price Holds Ground
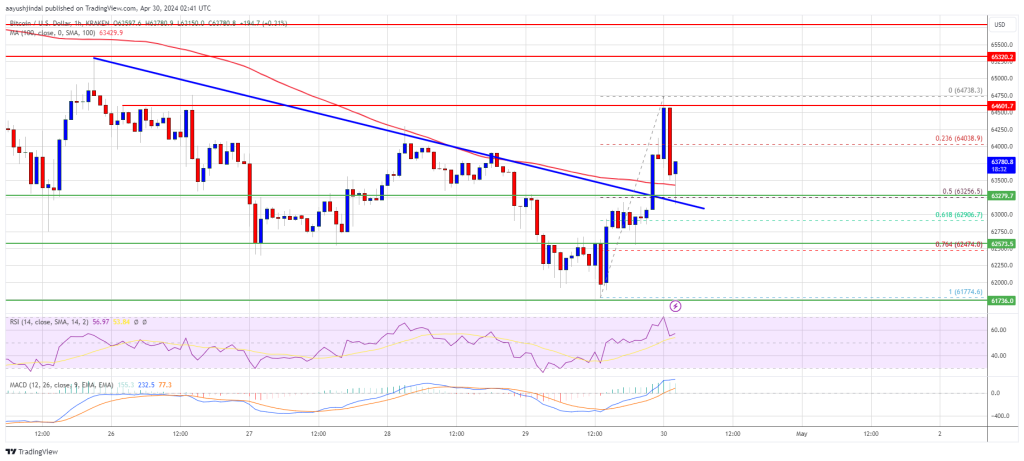
Bitcoin price started another decline below the $63,500 pivot level. BTC dropped below the $62,000 level before the bulls emerged. A low was formed at $61,774 and the price started a recovery wave.
There was a move above the $62,500 and $63,500 resistance levels. Besides, there was a break above a key bearish trend line with resistance at $63,250 on the hourly chart of the BTC/USD pair. The pair even spiked above $64,500 and tested $64,750.
A high was formed at $64,738 and the price started a downside correction. There was a move below the $64,000 level. The price tested the 50% Fib retracement level of the upward move from the $61,774 swing low to the $64,738 high.
Bitcoin is now trading above $63,500 and the 100 hourly Simple moving average. Immediate resistance is near the $64,000 level. The first major resistance could be $64,500 or $64,750. A clear move above the $64,750 resistance might send the price higher. The next resistance now sits at $65,500.
Source: BTCUSD on TradingView.com
If there is a clear move above the $65,500 resistance zone, the price could continue to move up. In the stated case, the price could rise toward $66,200. The next major resistance is near the $68,000 zone. Any more gains might send Bitcoin toward the $70,000 resistance zone in the near term.
Another Decline In BTC?
If Bitcoin fails to rise above the $64,750 resistance zone, it could continue to move down. Immediate support on the downside is near the $63,500 level.
The first major support is $63,000. If there is a close below $63,000, the price could start to drop toward $61,750. Any more losses might send the price toward the $61,200 support zone in the near term.
Technical indicators:
Hourly MACD – The MACD is now losing pace in the bullish zone.
Hourly RSI (Relative Strength Index) – The RSI for BTC/USD is now above the 50 level.
Major Support Levels – $63,500, followed by $63,000.
Major Resistance Levels – $64,000, $64,500, and $65,500.


