
Bitcoin’s price has been exhibiting silent price action following an attempt to surpass its all-time high of $73.7K, resulting in a period of low-volatility sideways consolidation.
However, there are indications of a potential corrective phase in the mid-term as the price forms a double-top pattern.
Technical Analysis
By Shayan
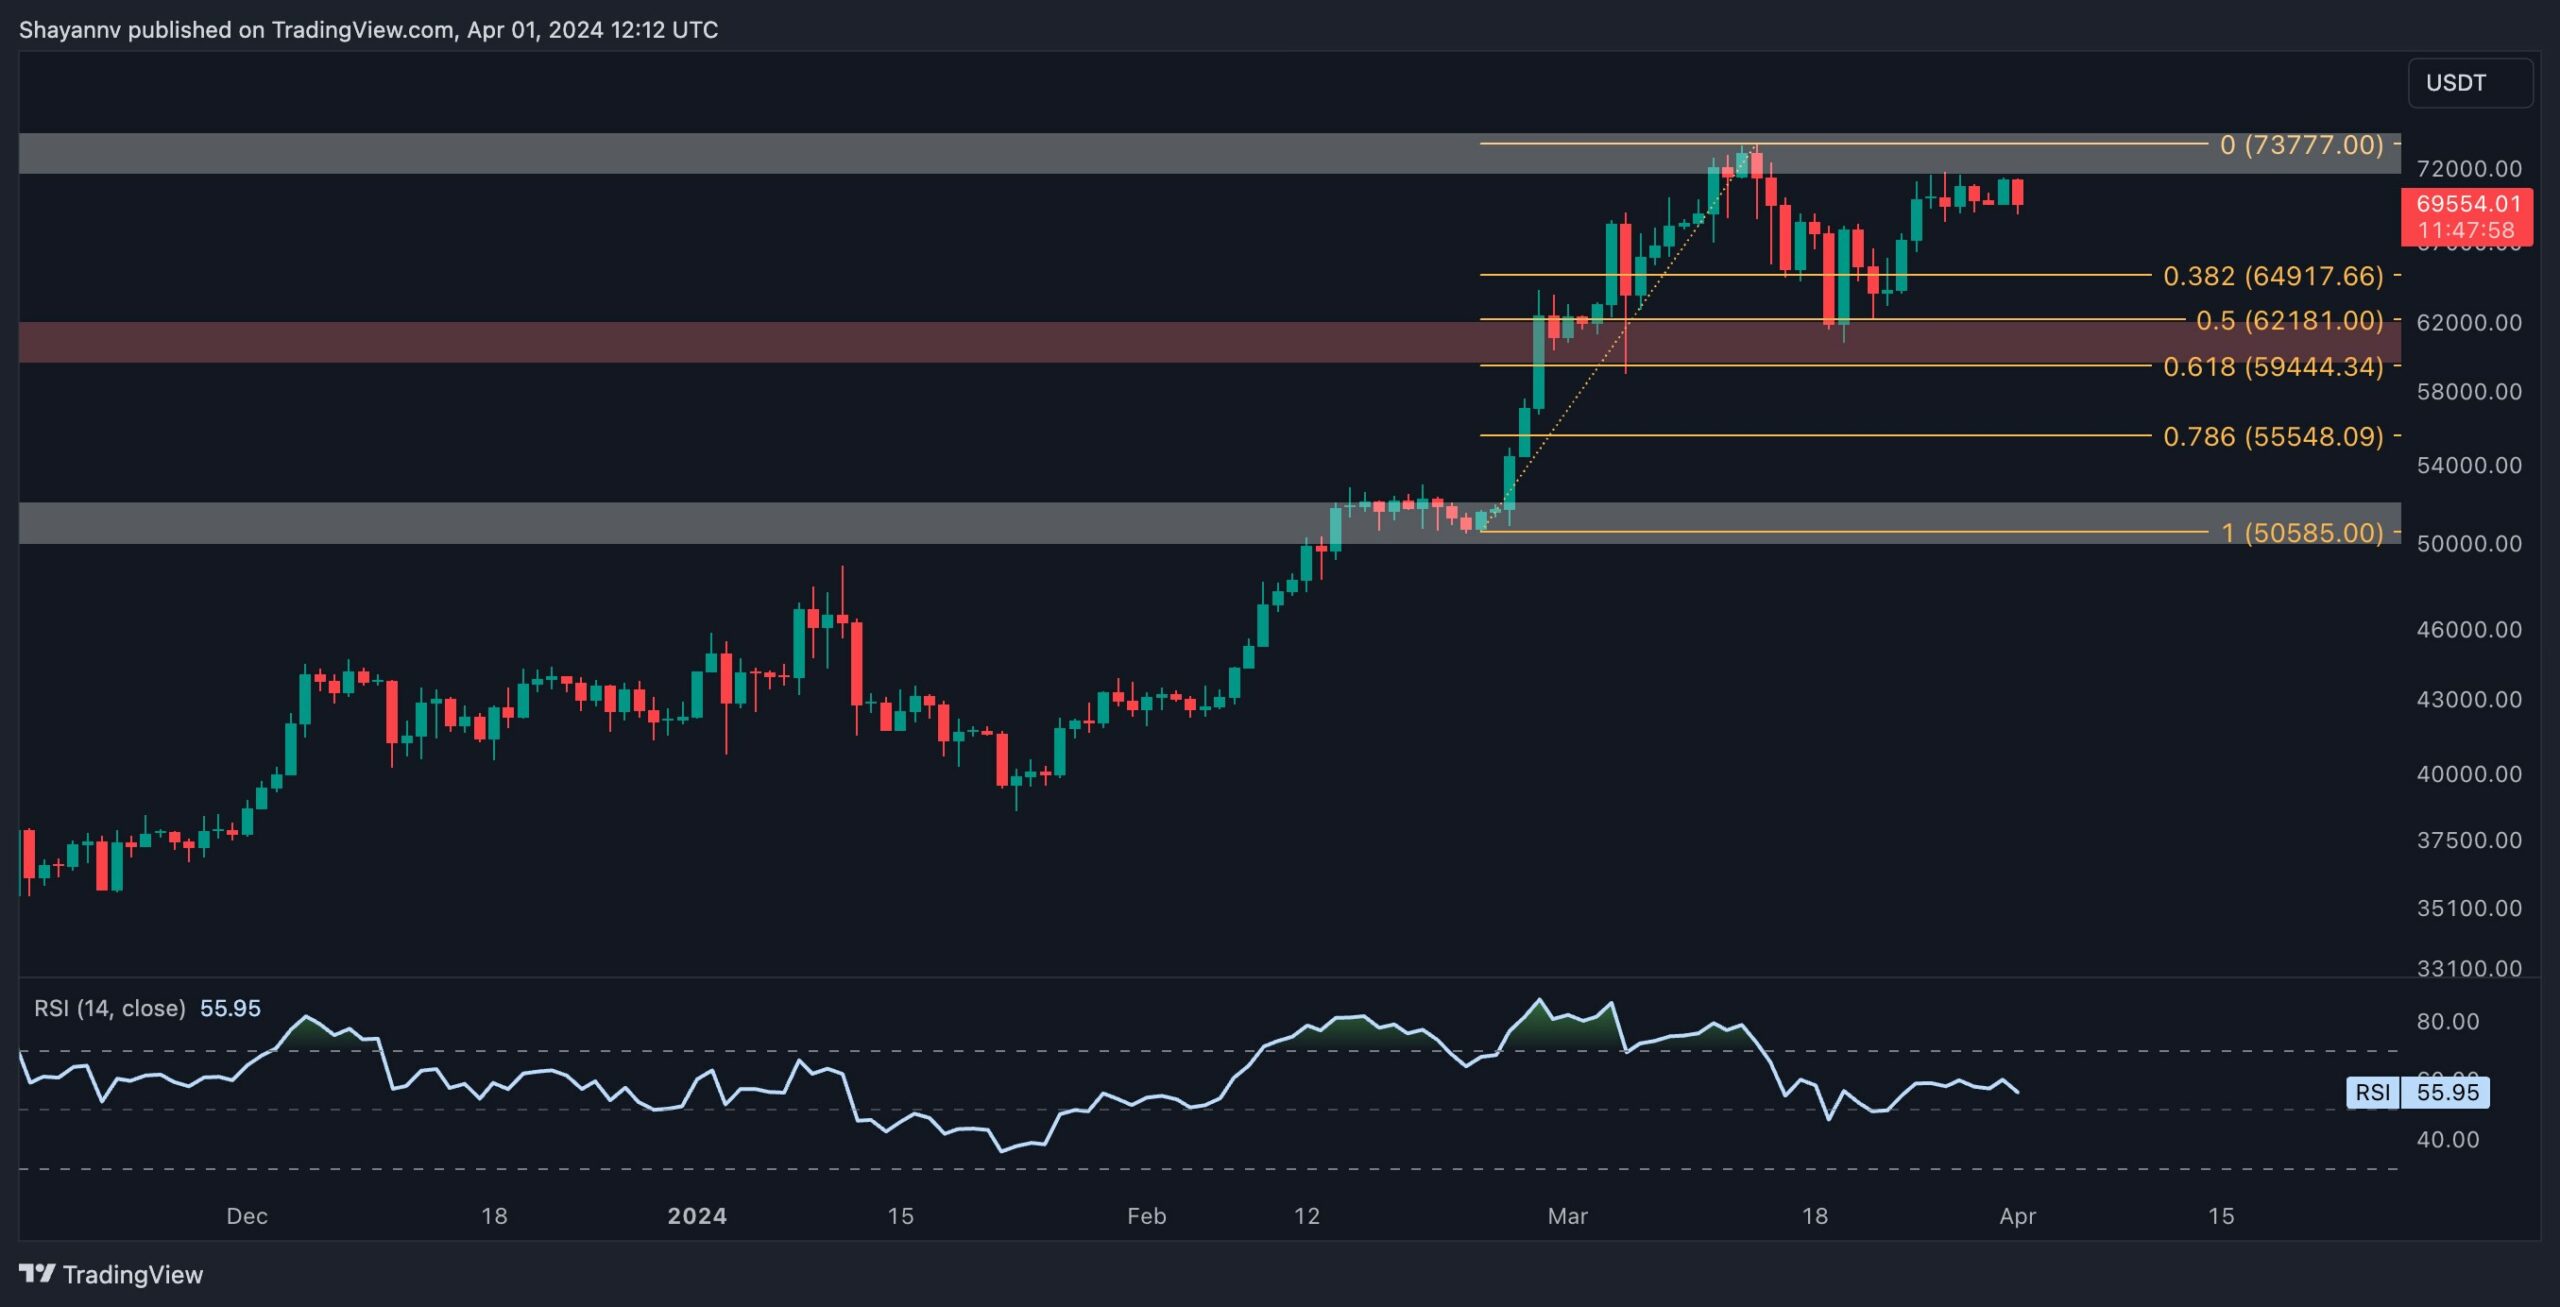
The Daily Chart
A comprehensive analysis of the daily chart reveals that Bitcoin’s price encountered significant buying pressure in the crucial support region, defined by the 0.5 ($62K) and 0.618 ($59.5K) Fibonacci retracement levels.
This led to a renewed bullish surge towards the $72K resistance region. However, the price failed to breach this crucial resistance zone and faced rejection, subsequently entering a sideways consolidation stage with minimal volatility.
Presently, the price is shaping a double-top pattern, with the neckline positioned at the $62K threshold. If BTC fails to reclaim the $72K level and undergoes a retracement, the completion of the pattern may trigger an extended downward movement, with the $58K critical support region becoming Bitcoin’s next potential destination.
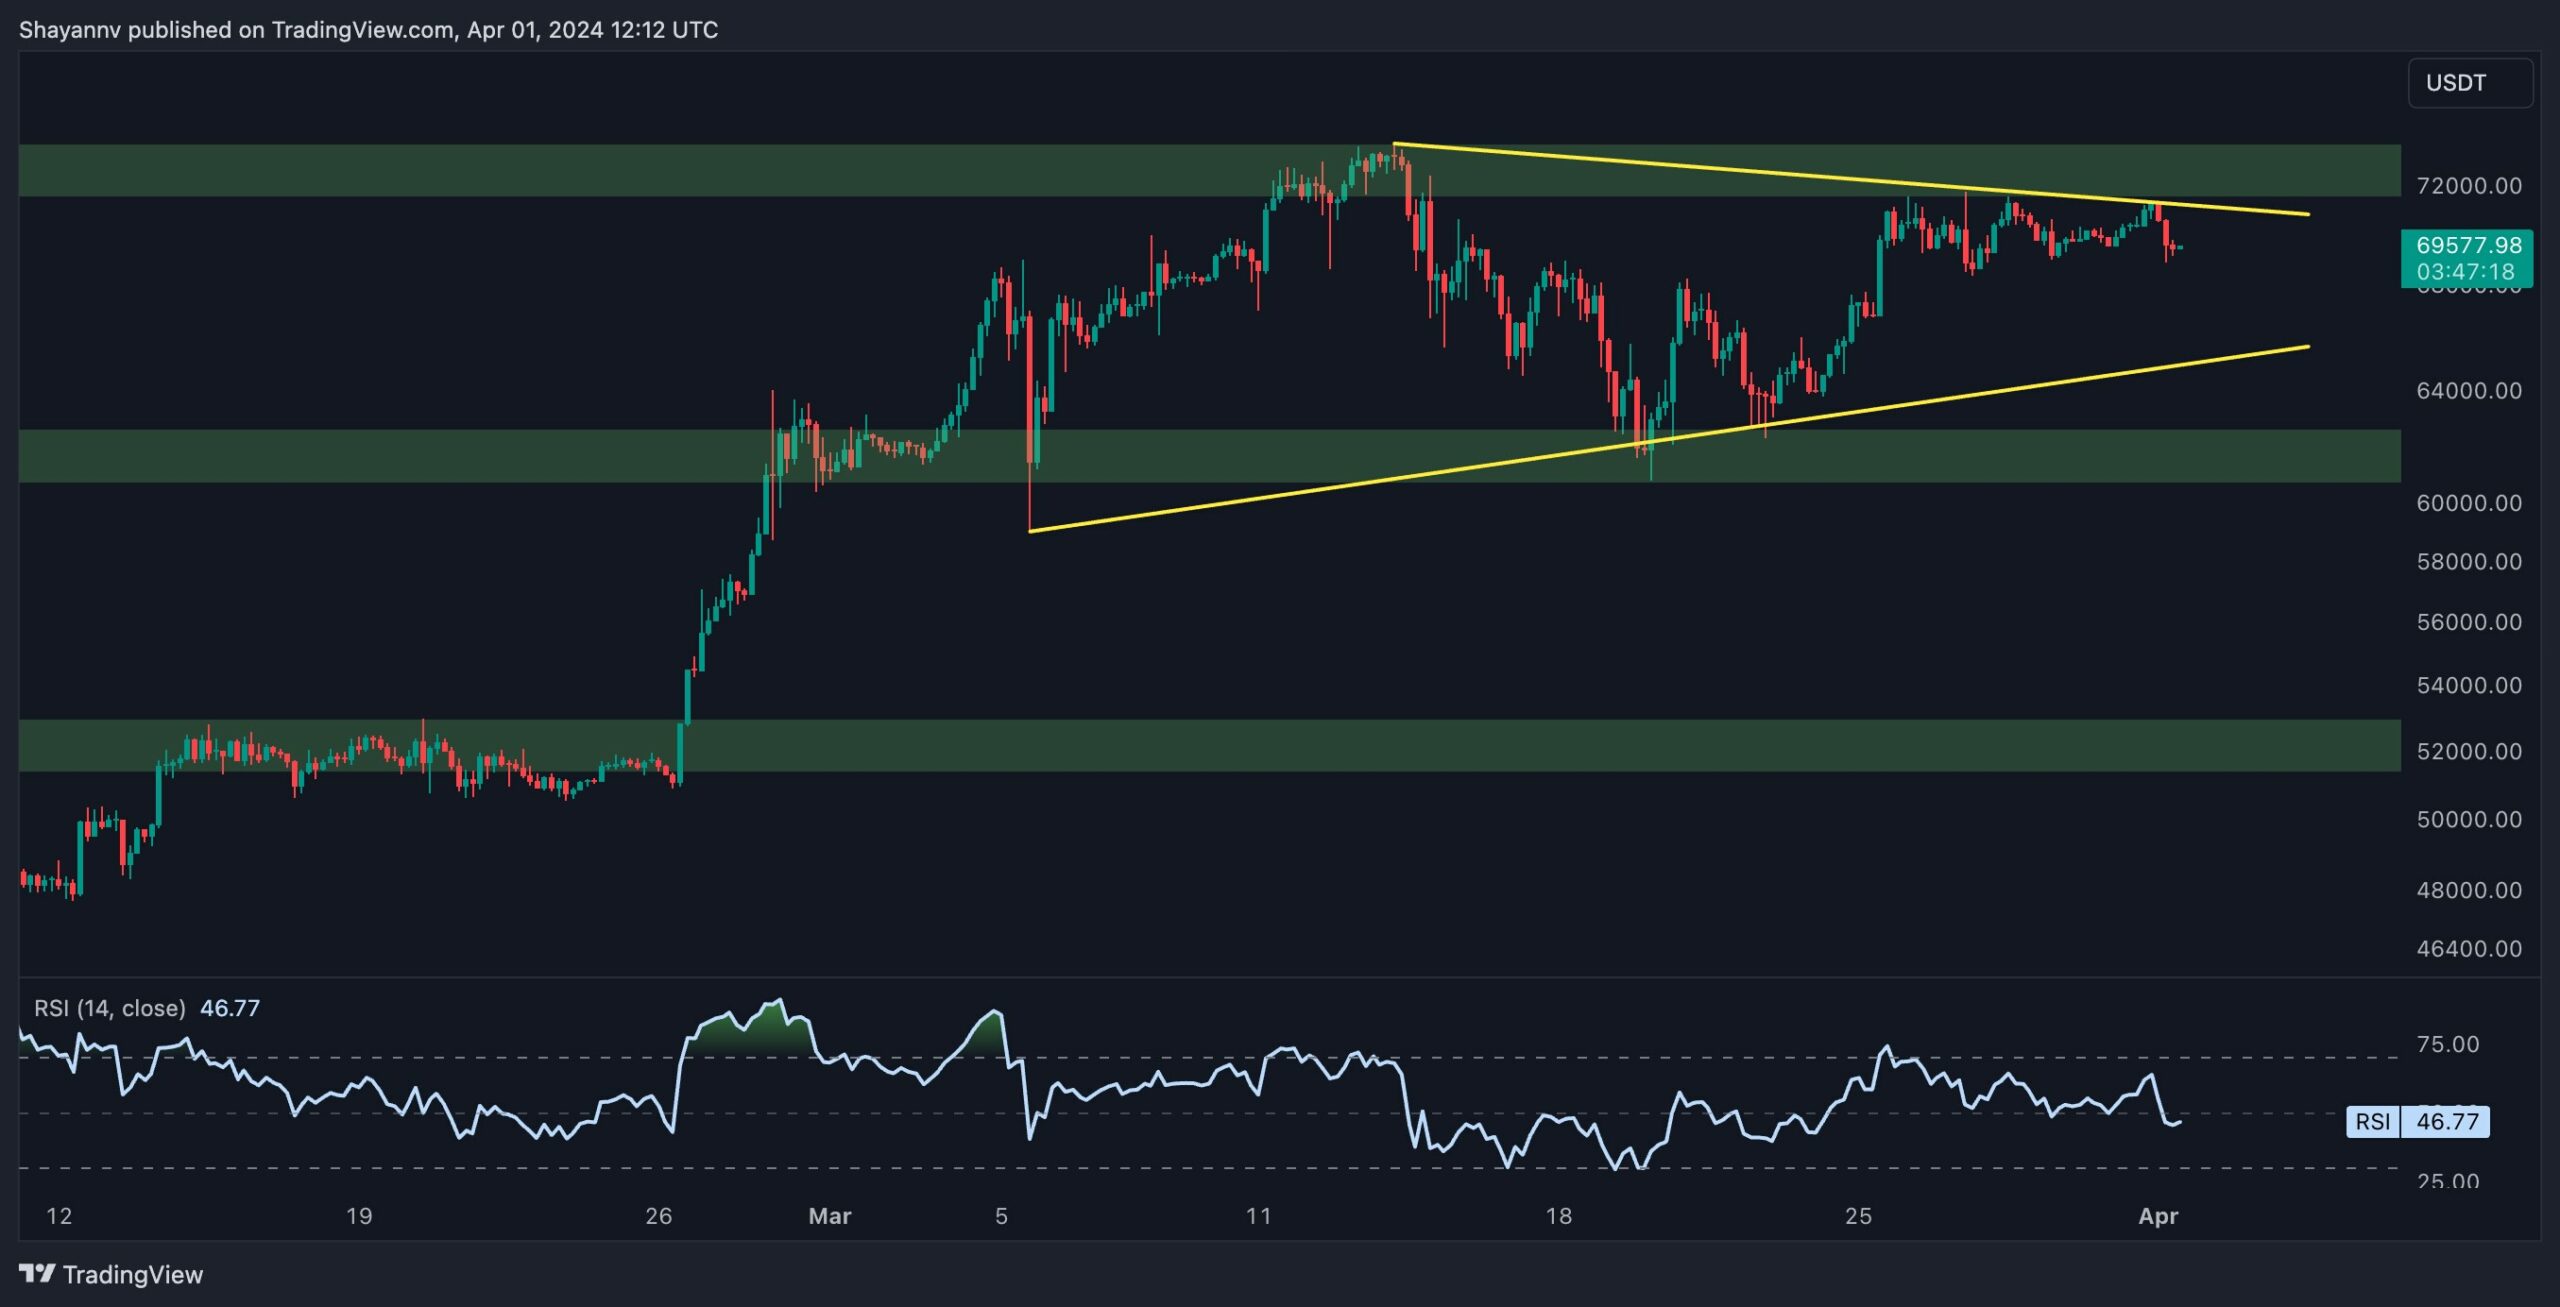
The 4-Hour Chart
Examining the 4-hour chart, it’s evident that Bitcoin witnessed significant demand near the crucial $62K support region, resulting in a notable price surge. This buying pressure aimed to propel the price towards the $72K resistance level in anticipation of establishing a new all-time high before the halving event.
However, upon reaching the $72K threshold, the price encountered substantial selling pressure, halting its upward momentum.
Presently, Bitcoin has formed a sideways triangle pattern, attempting to breach its upper boundary. Should buyers regain control and manage to push the price to surpass the triangle’s upper boundary, an expansion of the bullish movement would be imminent. Conversely, if selling pressure intensifies, a retracement towards the triangle’s lower boundary would be the most probable outcome.
On-chain Analysis
By Shayan
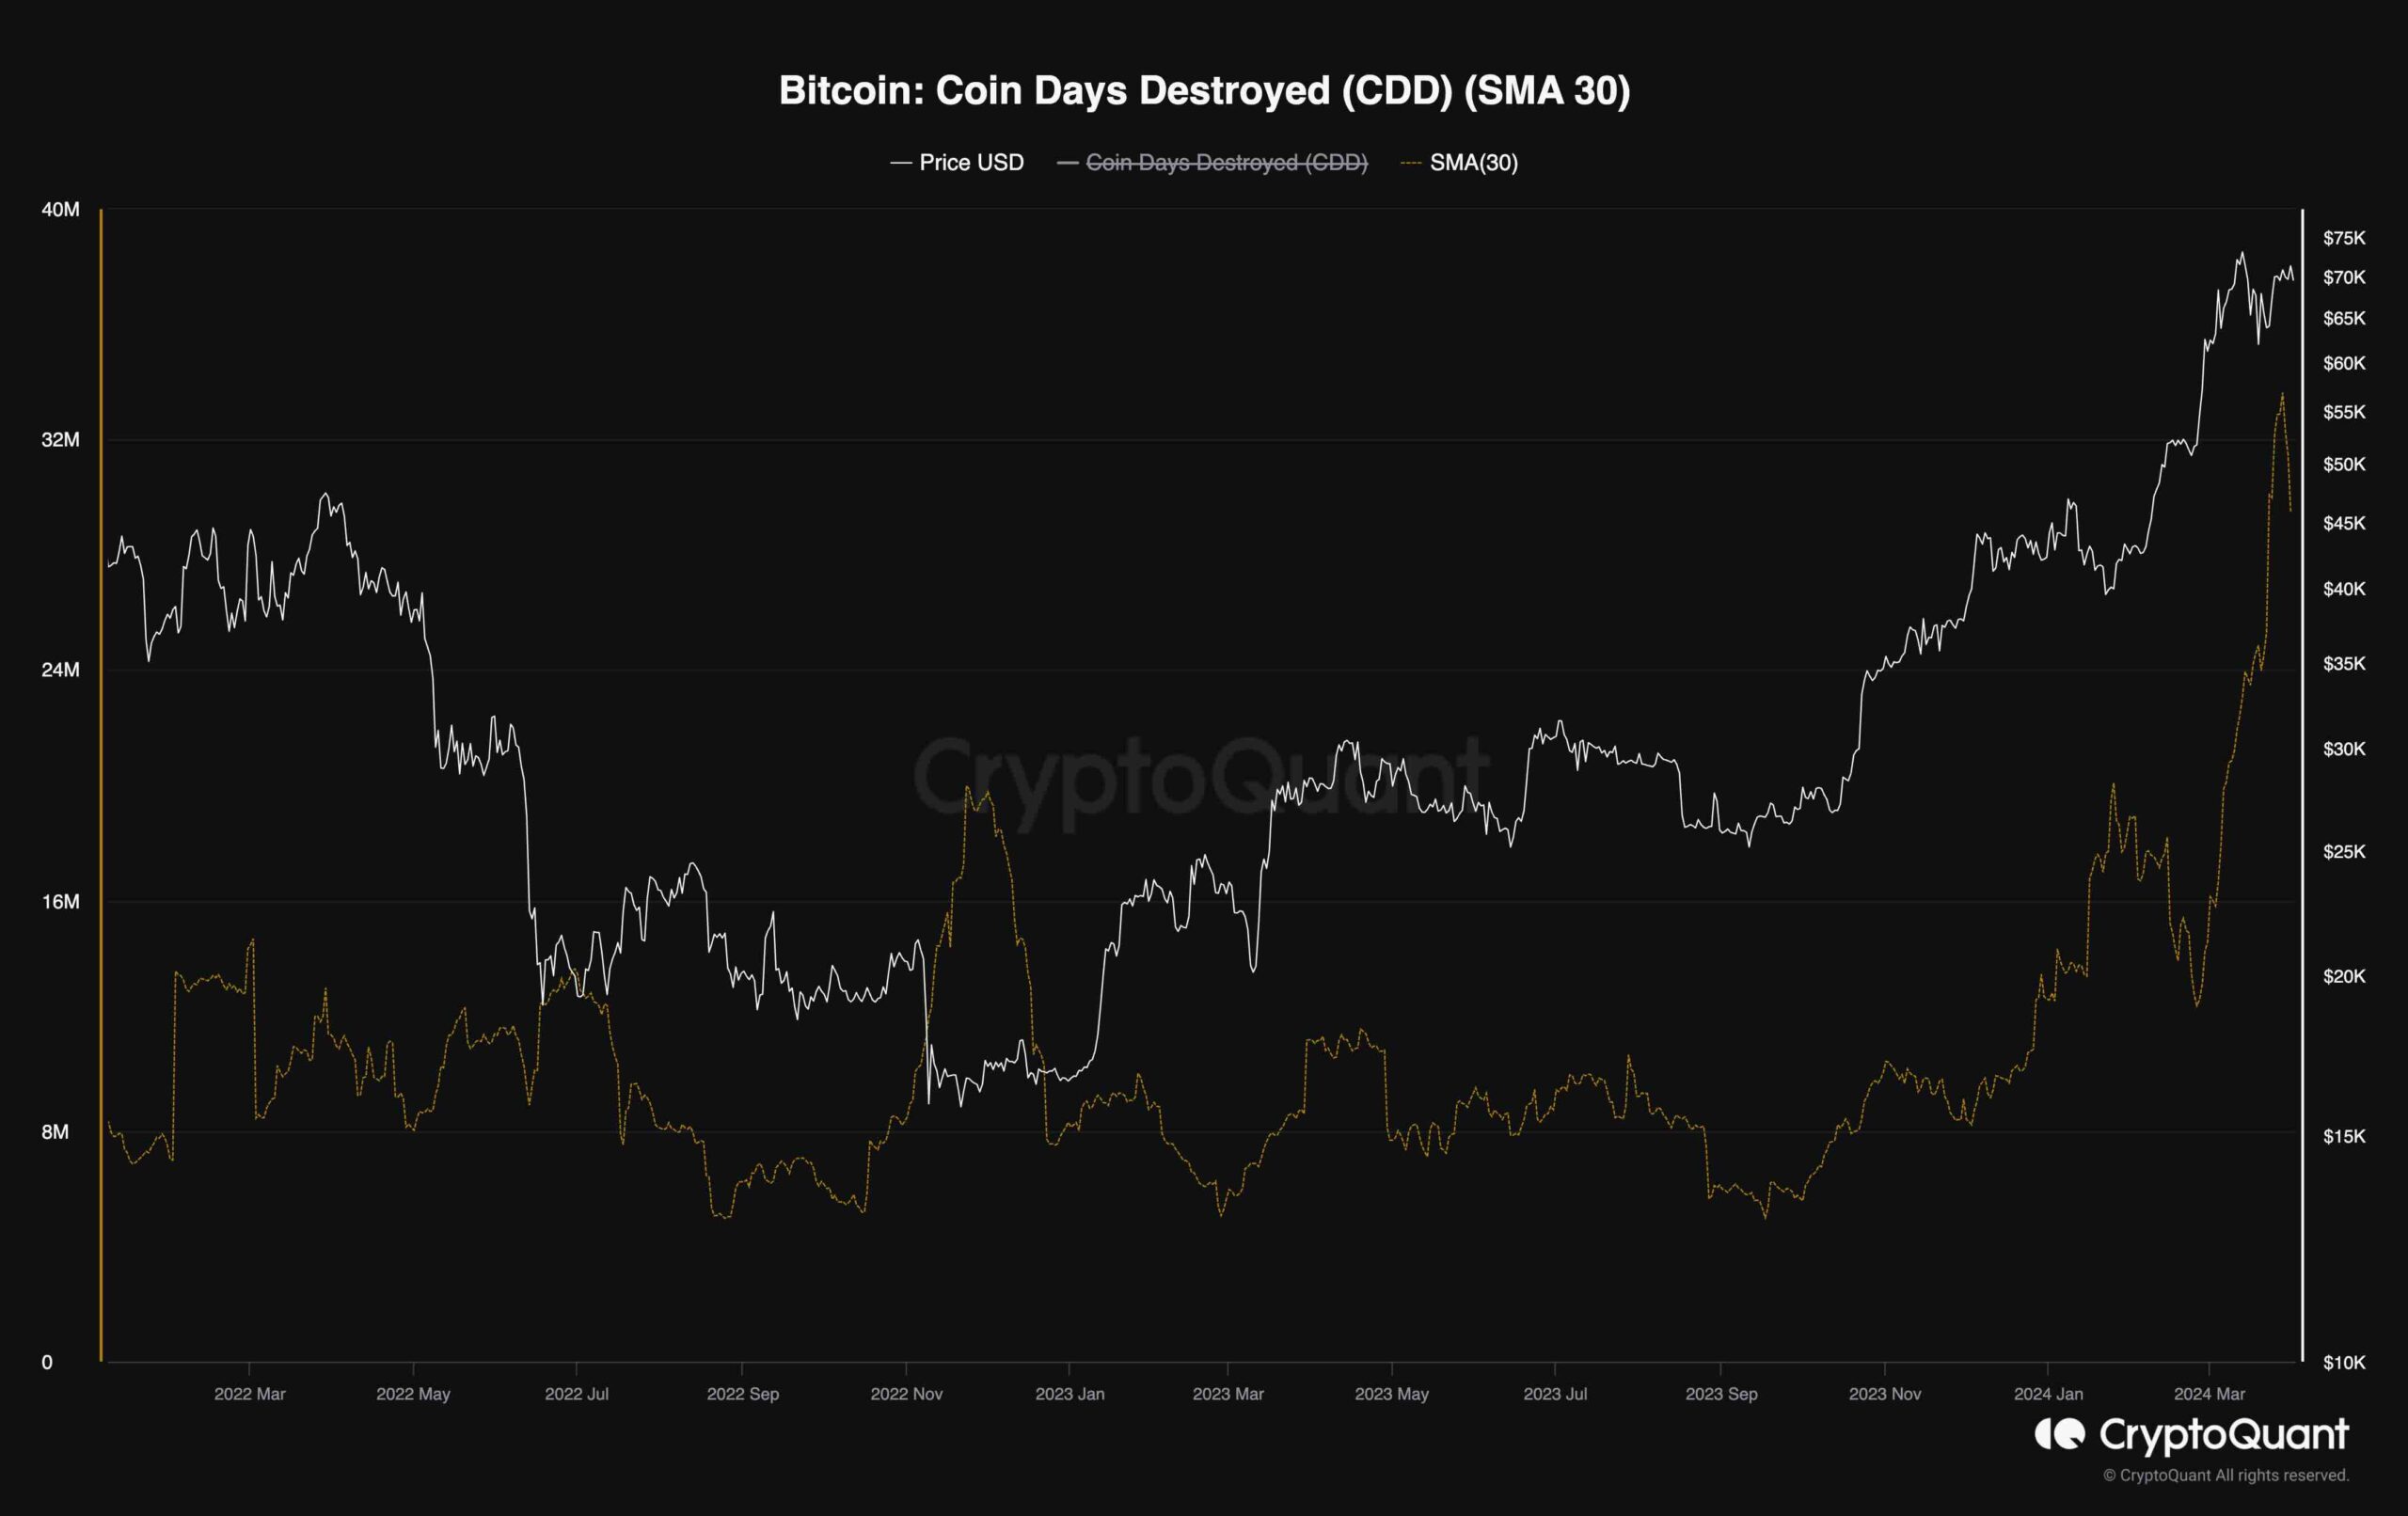
Coin Days Destroyed is a metric that gauges the volume of Bitcoin transacted daily, adjusted based on how long the Bitcoin has remained inactive. It calculates the number of coin days by multiplying the amount of Bitcoin transacted by the number of days it has been held without movement. This metric highlights the significance of transactions involving long-held or “aged” Unspent Transaction Outputs (UTXOs) and the overall Bitcoin volume involved.
The recent peak in Coin Days Destroyed, observed with a 30-day moving average, stands at 23.2 million. This indicates substantial movement of Bitcoin that had been dormant for an extended period, reminiscent of the patterns observed during the bullish phases of 2017 and 2021.
Such a pattern suggests that during bullish phases, older coins are being distributed. However, it is essential to acknowledge the current trend while also considering the distribution among long-term holders, which can potentially lead to notable market corrections.
The post BTC Dump Incoming? Worrying Patterns Appear as Bulls Remain Uncertain at $70K (Bitcoin Price Analysis) appeared first on CryptoPotato.


