
Polkadot has recently found support within a pivotal zone encompassing the price range delineated by the 0.5 ($8.9) and 0.618 ($8.2) Fib retracement levels and the influential 100-day moving average.
This development, following a prolonged period of consolidation correction, indicates a potential bullish revival in the medium term.
Technical Analysis
By Shayan
The Daily Chart
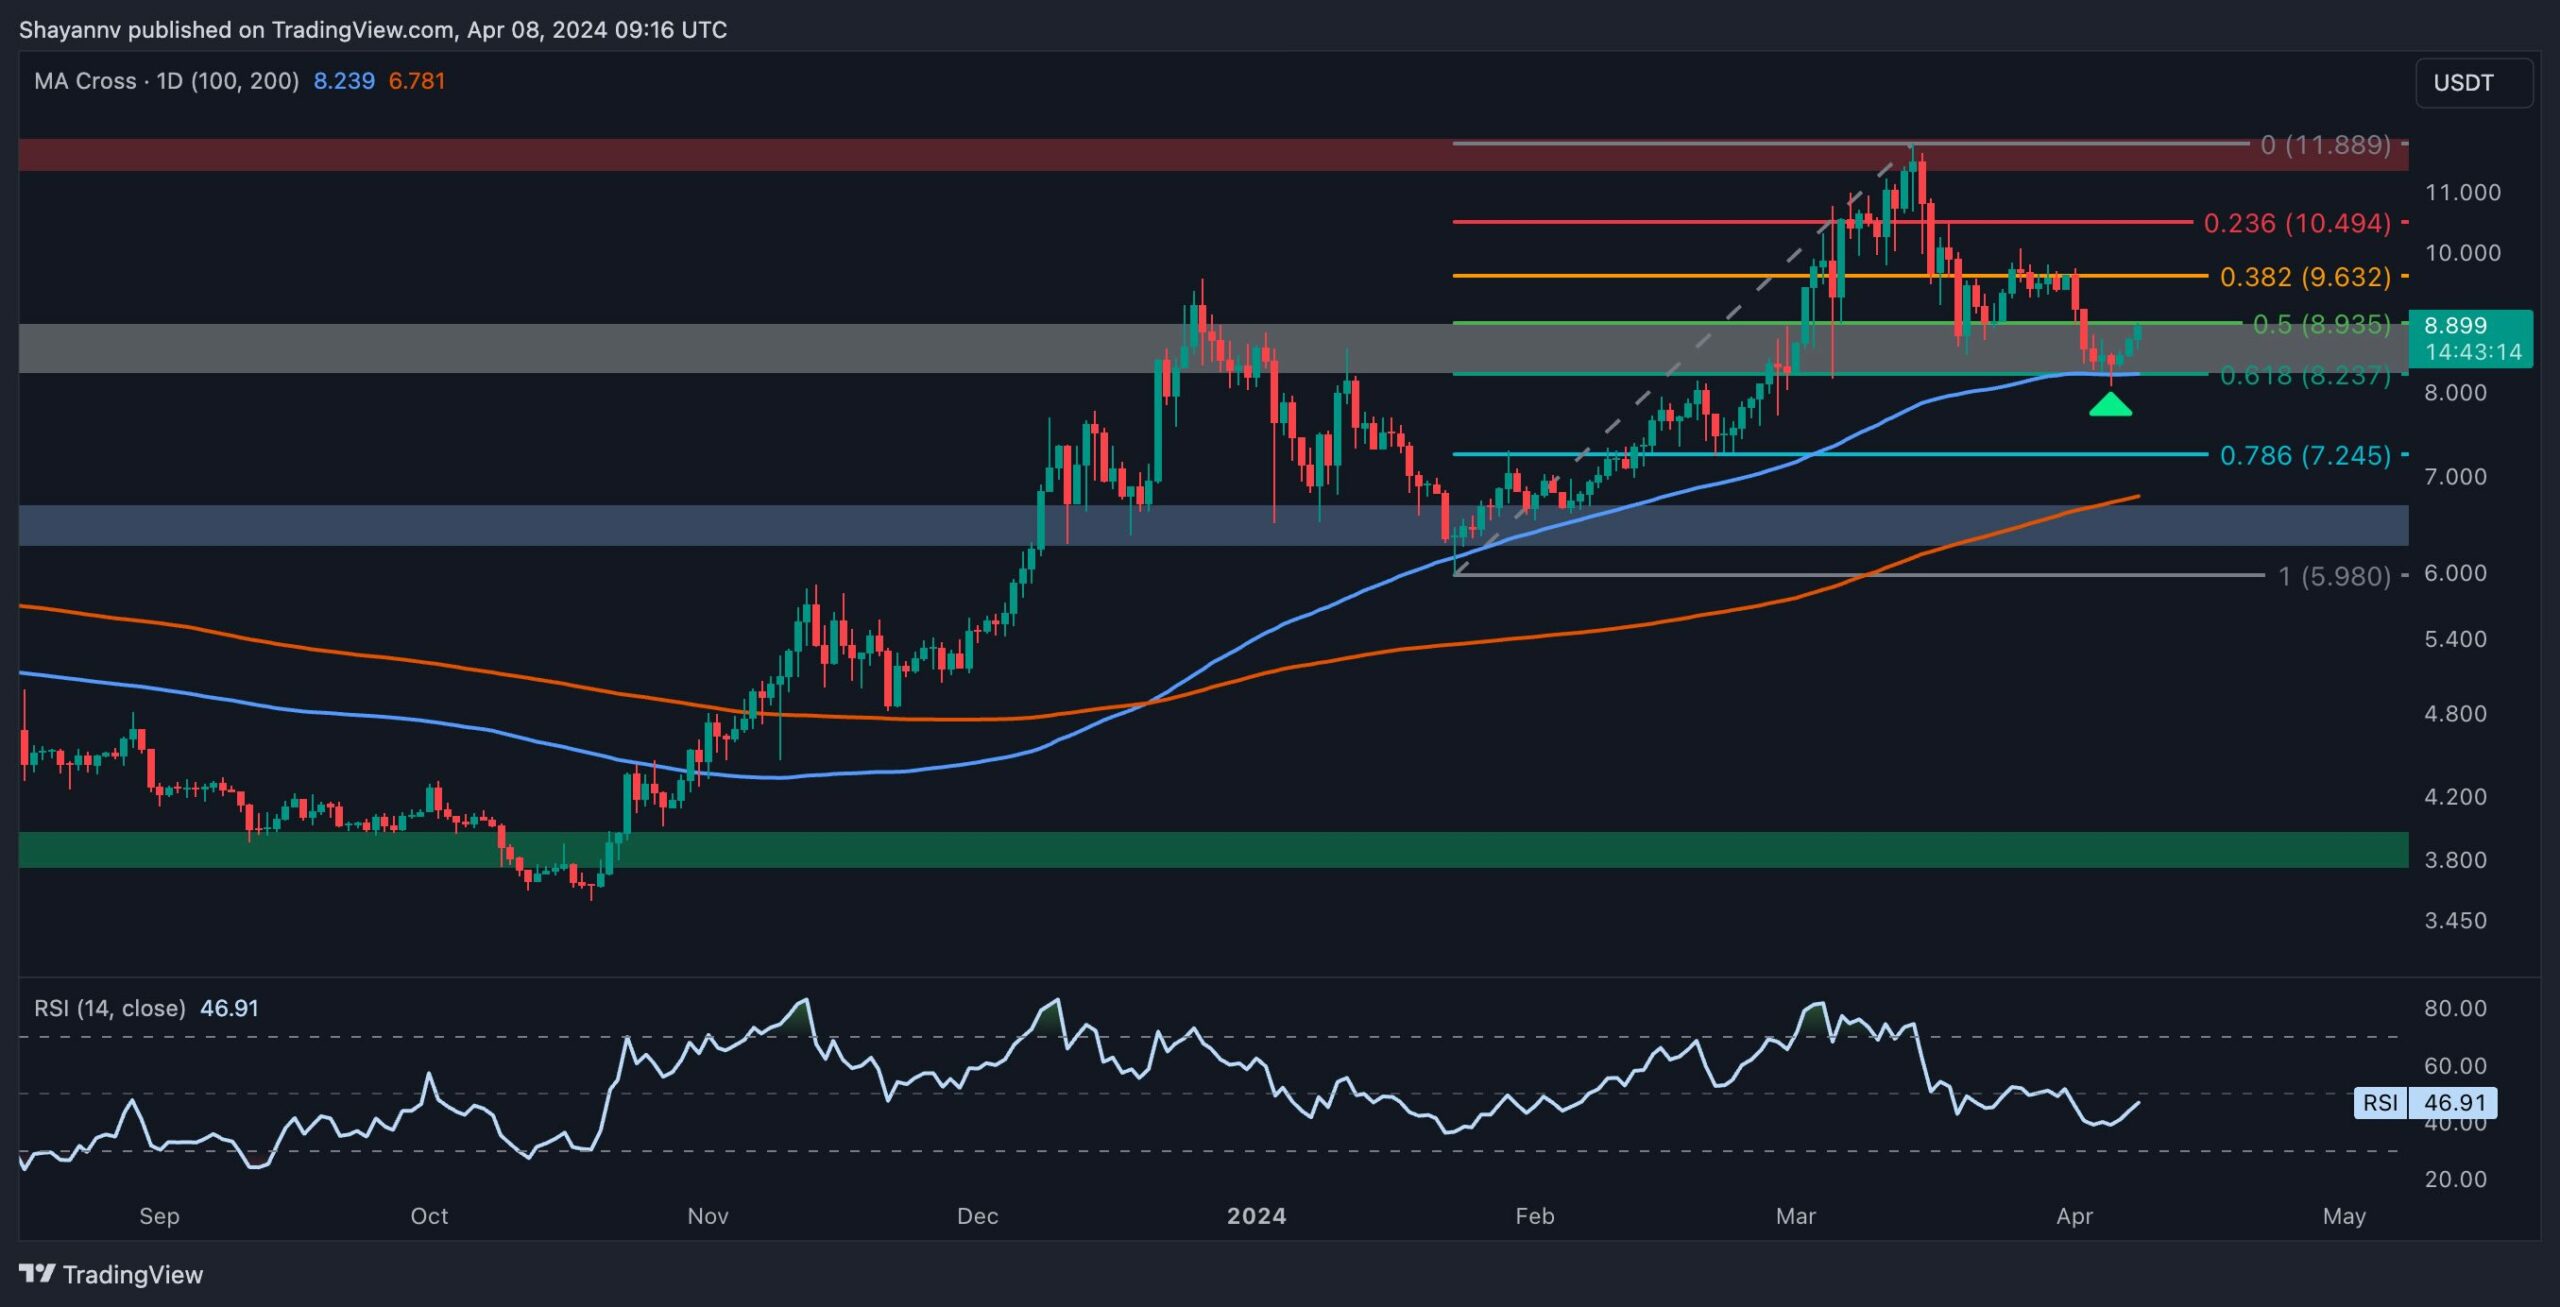
Examining the daily chart, it is evident that Polkadot experienced a significant uptrend following a break above the 100 and 200-day moving averages in early November 2023. This surge culminated in a yearly high of $11.9, underscoring a prevailing bullish sentiment with buyers dominating the market.
However, the ascent was met with considerable selling pressure around the $11.9 resistance zone, leading to an extended corrective retracement towards a robust support region. The latter is largely defined by the Fibonacci retracement levels of 0.5 ($8.9) and 0.618 ($8.2), coinciding with the prominent 100-day moving average, making it a robust barrier to sellers.
The convergence of these support levels suggests a pronounced demand at this critical juncture, potentially impeding further downward movement. Yet, DOT’s immediate objective remains the pivotal $10 resistance level upon a bullish rebound.
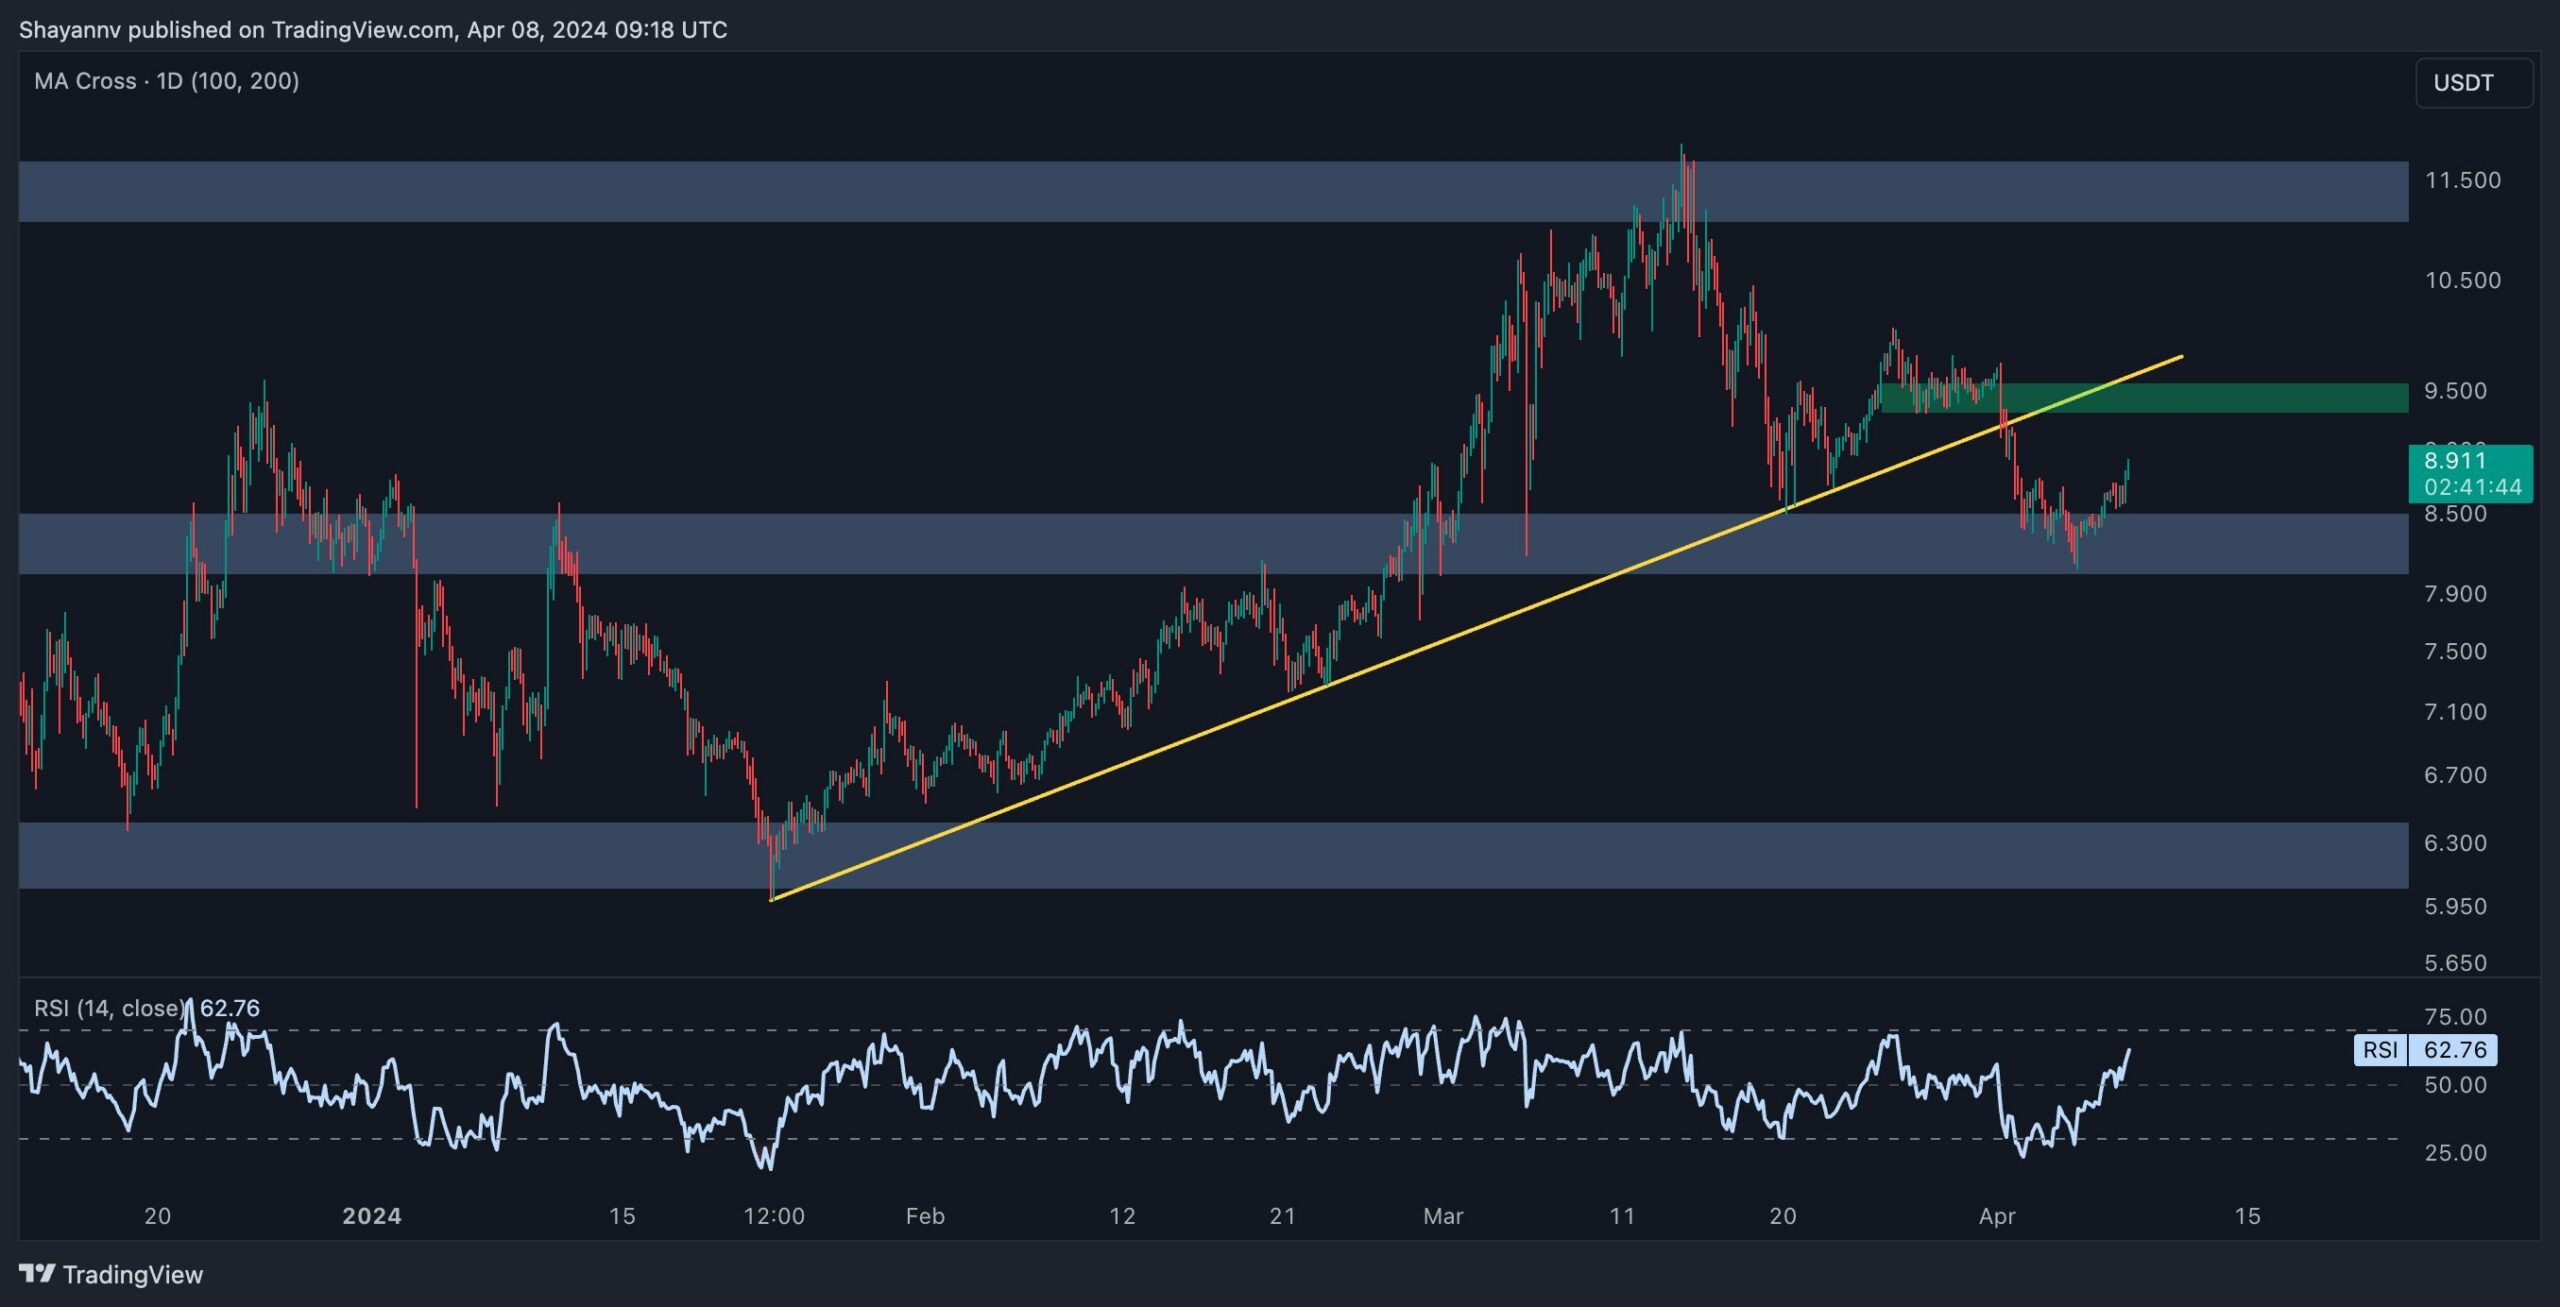
The 4-Hour Chart
A thorough examination of the 4-hour timeframe reveals an extended consolidation correction subsequent to a robust uptrend that propelled DOT’s price to the $11.9 threshold. This phase witnessed a significant breach below the multi-week ascending trendline, likely triggered by profit-taking and liquidation of long positions.
However, upon reaching the key support level at $8, the cryptocurrency experienced intensified buying pressure, sparking a modest reversal. Nonetheless, the recent rebound could be construed as a minor retracement, possibly aimed at completing a pullback toward the breached trendline near the crucial $10 mark. Should the price fulfill this pullback, the prospect of a bearish retracement aiming to breach the decisive $8 support region becomes plausible.
Nevertheless, DOT appears to be confined within the price range bounded by the critical support at $8 and the notable resistance at $10 until a decisive breakout materializes.
Sentiment Analysis
By Shayan
The impact of futures market sentiment on Polkadot’s price trajectory holds undeniable significance, with historical evidence indicating that the intensity of these positions and the potential for substantial liquidations have been primary drivers of notable fluctuations. Hence, examining the ratio of long to short positions proves valuable for traders seeking insights into future price dynamics.
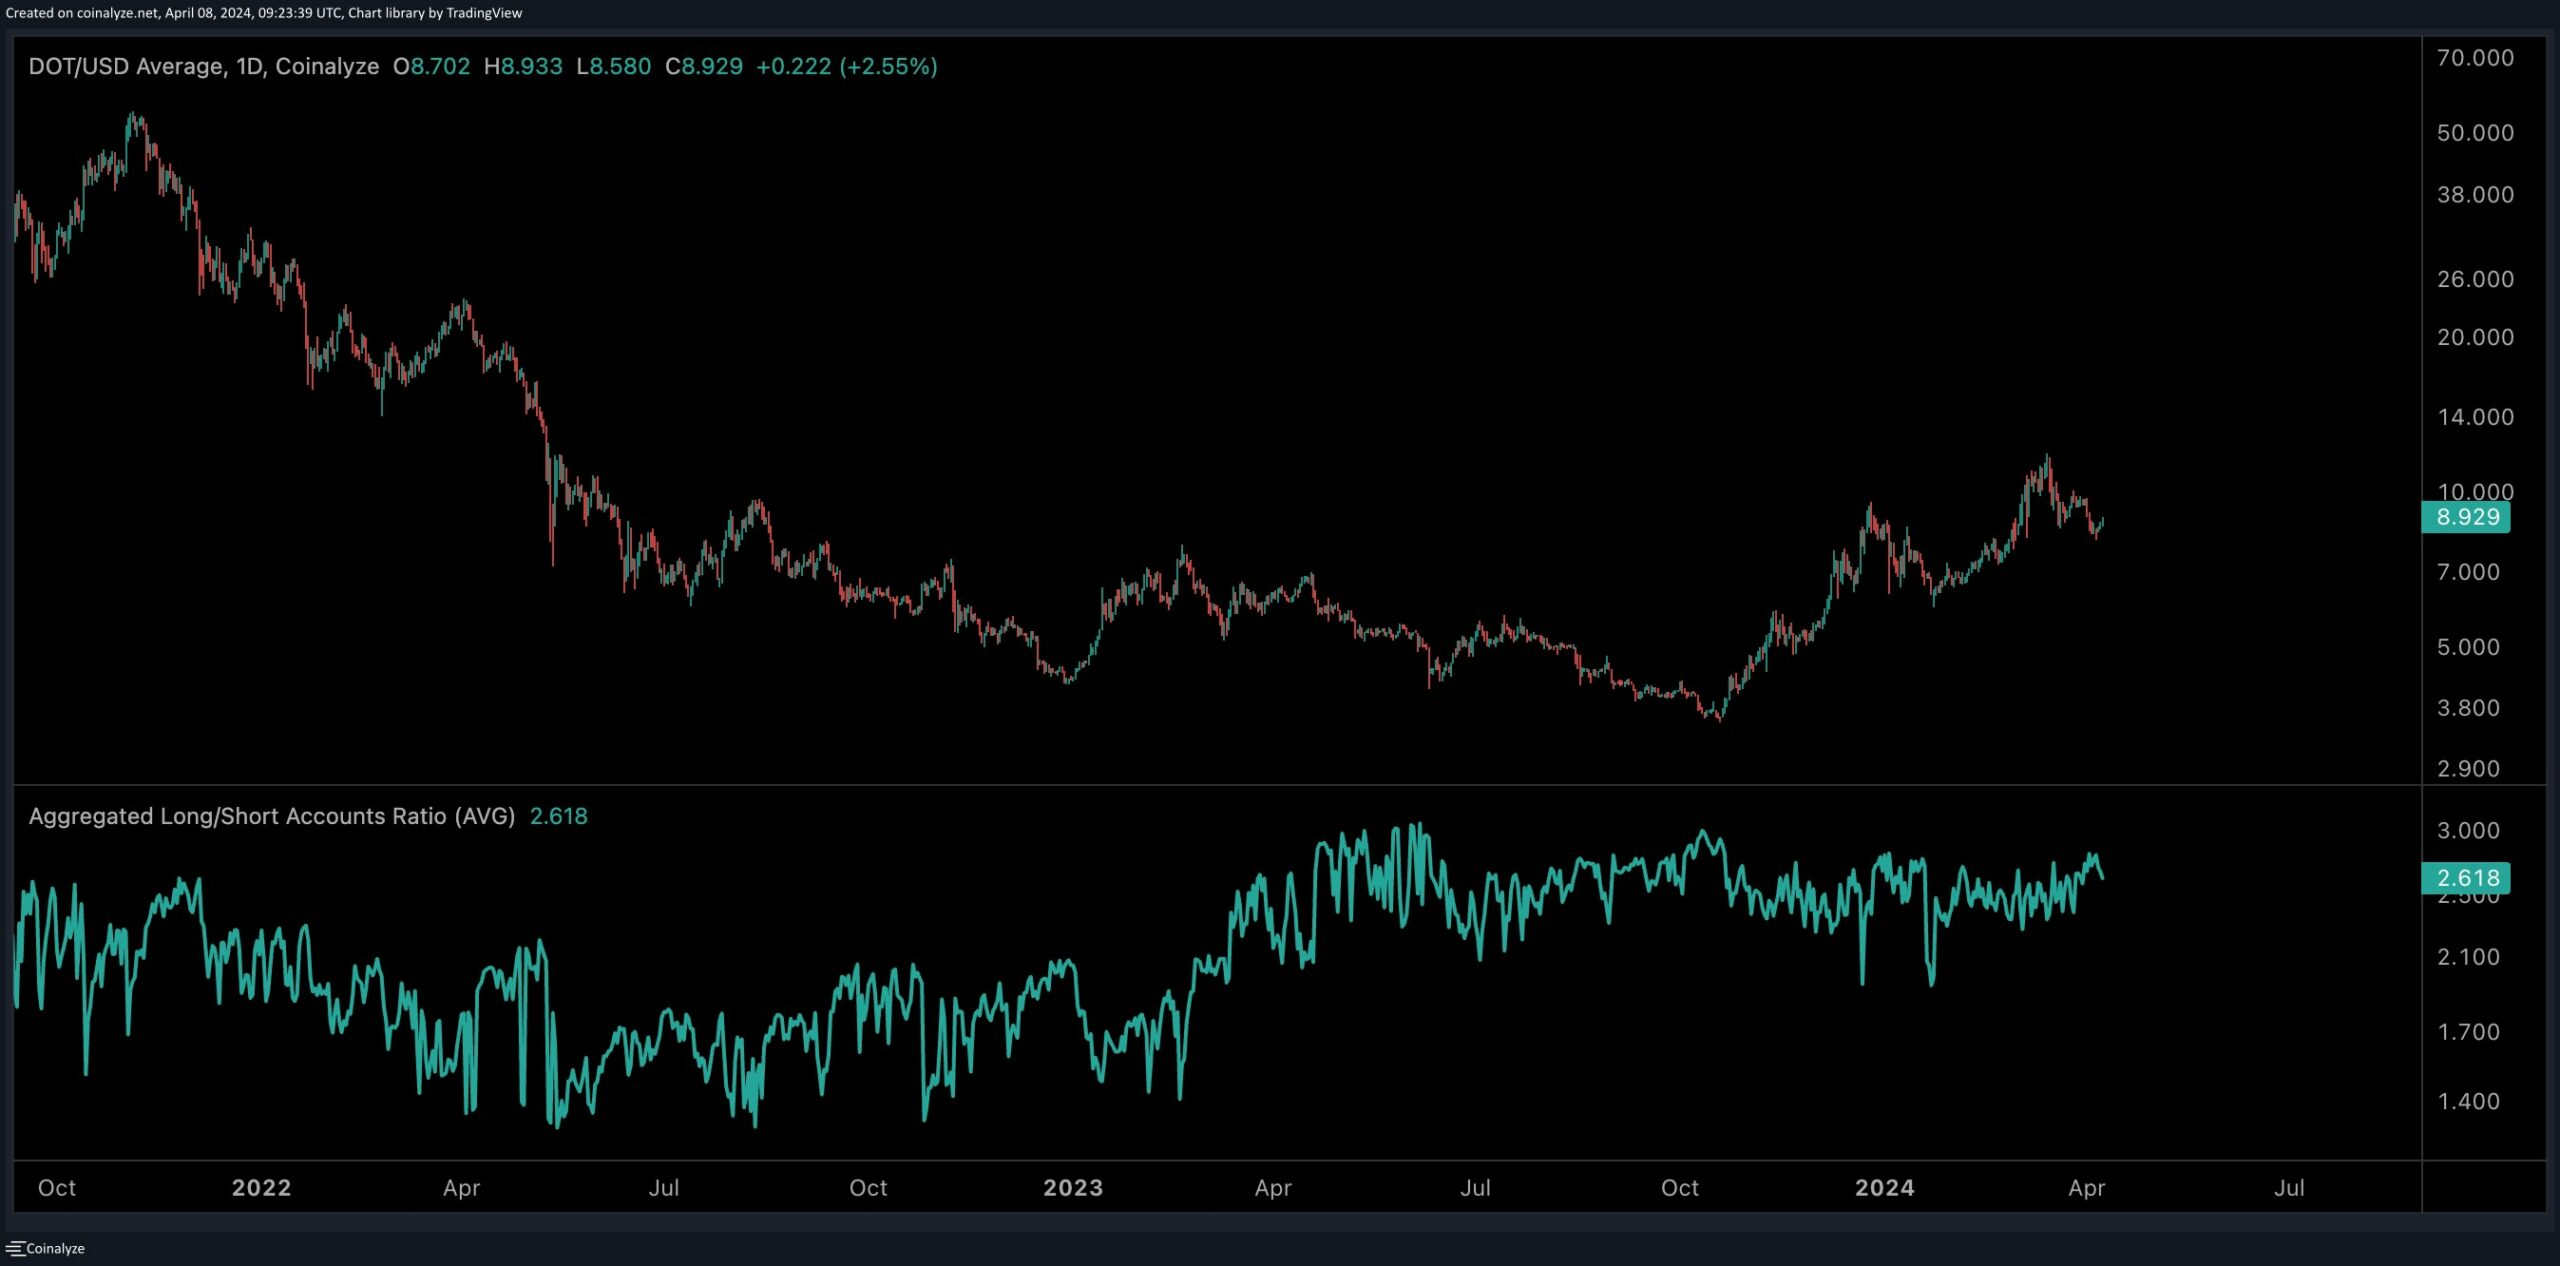
The following chart illustrates the aggregate long/short accounts ratio in conjunction with DOT’s price movements. This metric serves as a valuable gauge, depicting the proportion of net long and net short accounts on exchanges such as Binance and Bybit relative to the total accounts with positions. Values exceeding one signify a prevalent inclination towards long positions among participants.
As evident from the chart, the metric has recently undergone a significant reversal, exhibiting a consistent uptrend and attaining its highest recorded values. This pattern suggests a prevailing bullish sentiment in the futures market, with a majority of participants favoring long positions in aggregate. Consequently, this outlook implies that Polkadot is poised to embark on a robust bullish trajectory following the ongoing consolidation phase.
This post is powered by Polkadot.
The post DOT Price Analysis: Polkadot Bulls Looking Primed to Attack the $10 Critical Resistance appeared first on CryptoPotato.


