
Polkadot has been mired in a prolonged consolidation phase, hovering around the pivotal 200-day moving average and the $6.3 mark, reflecting uncertainty regarding its future trajectory.
However, a breach below this crucial support area could culminate in a decline towards the $5.1 threshold.
Technical Analysis
By Shayan
The Daily Chart
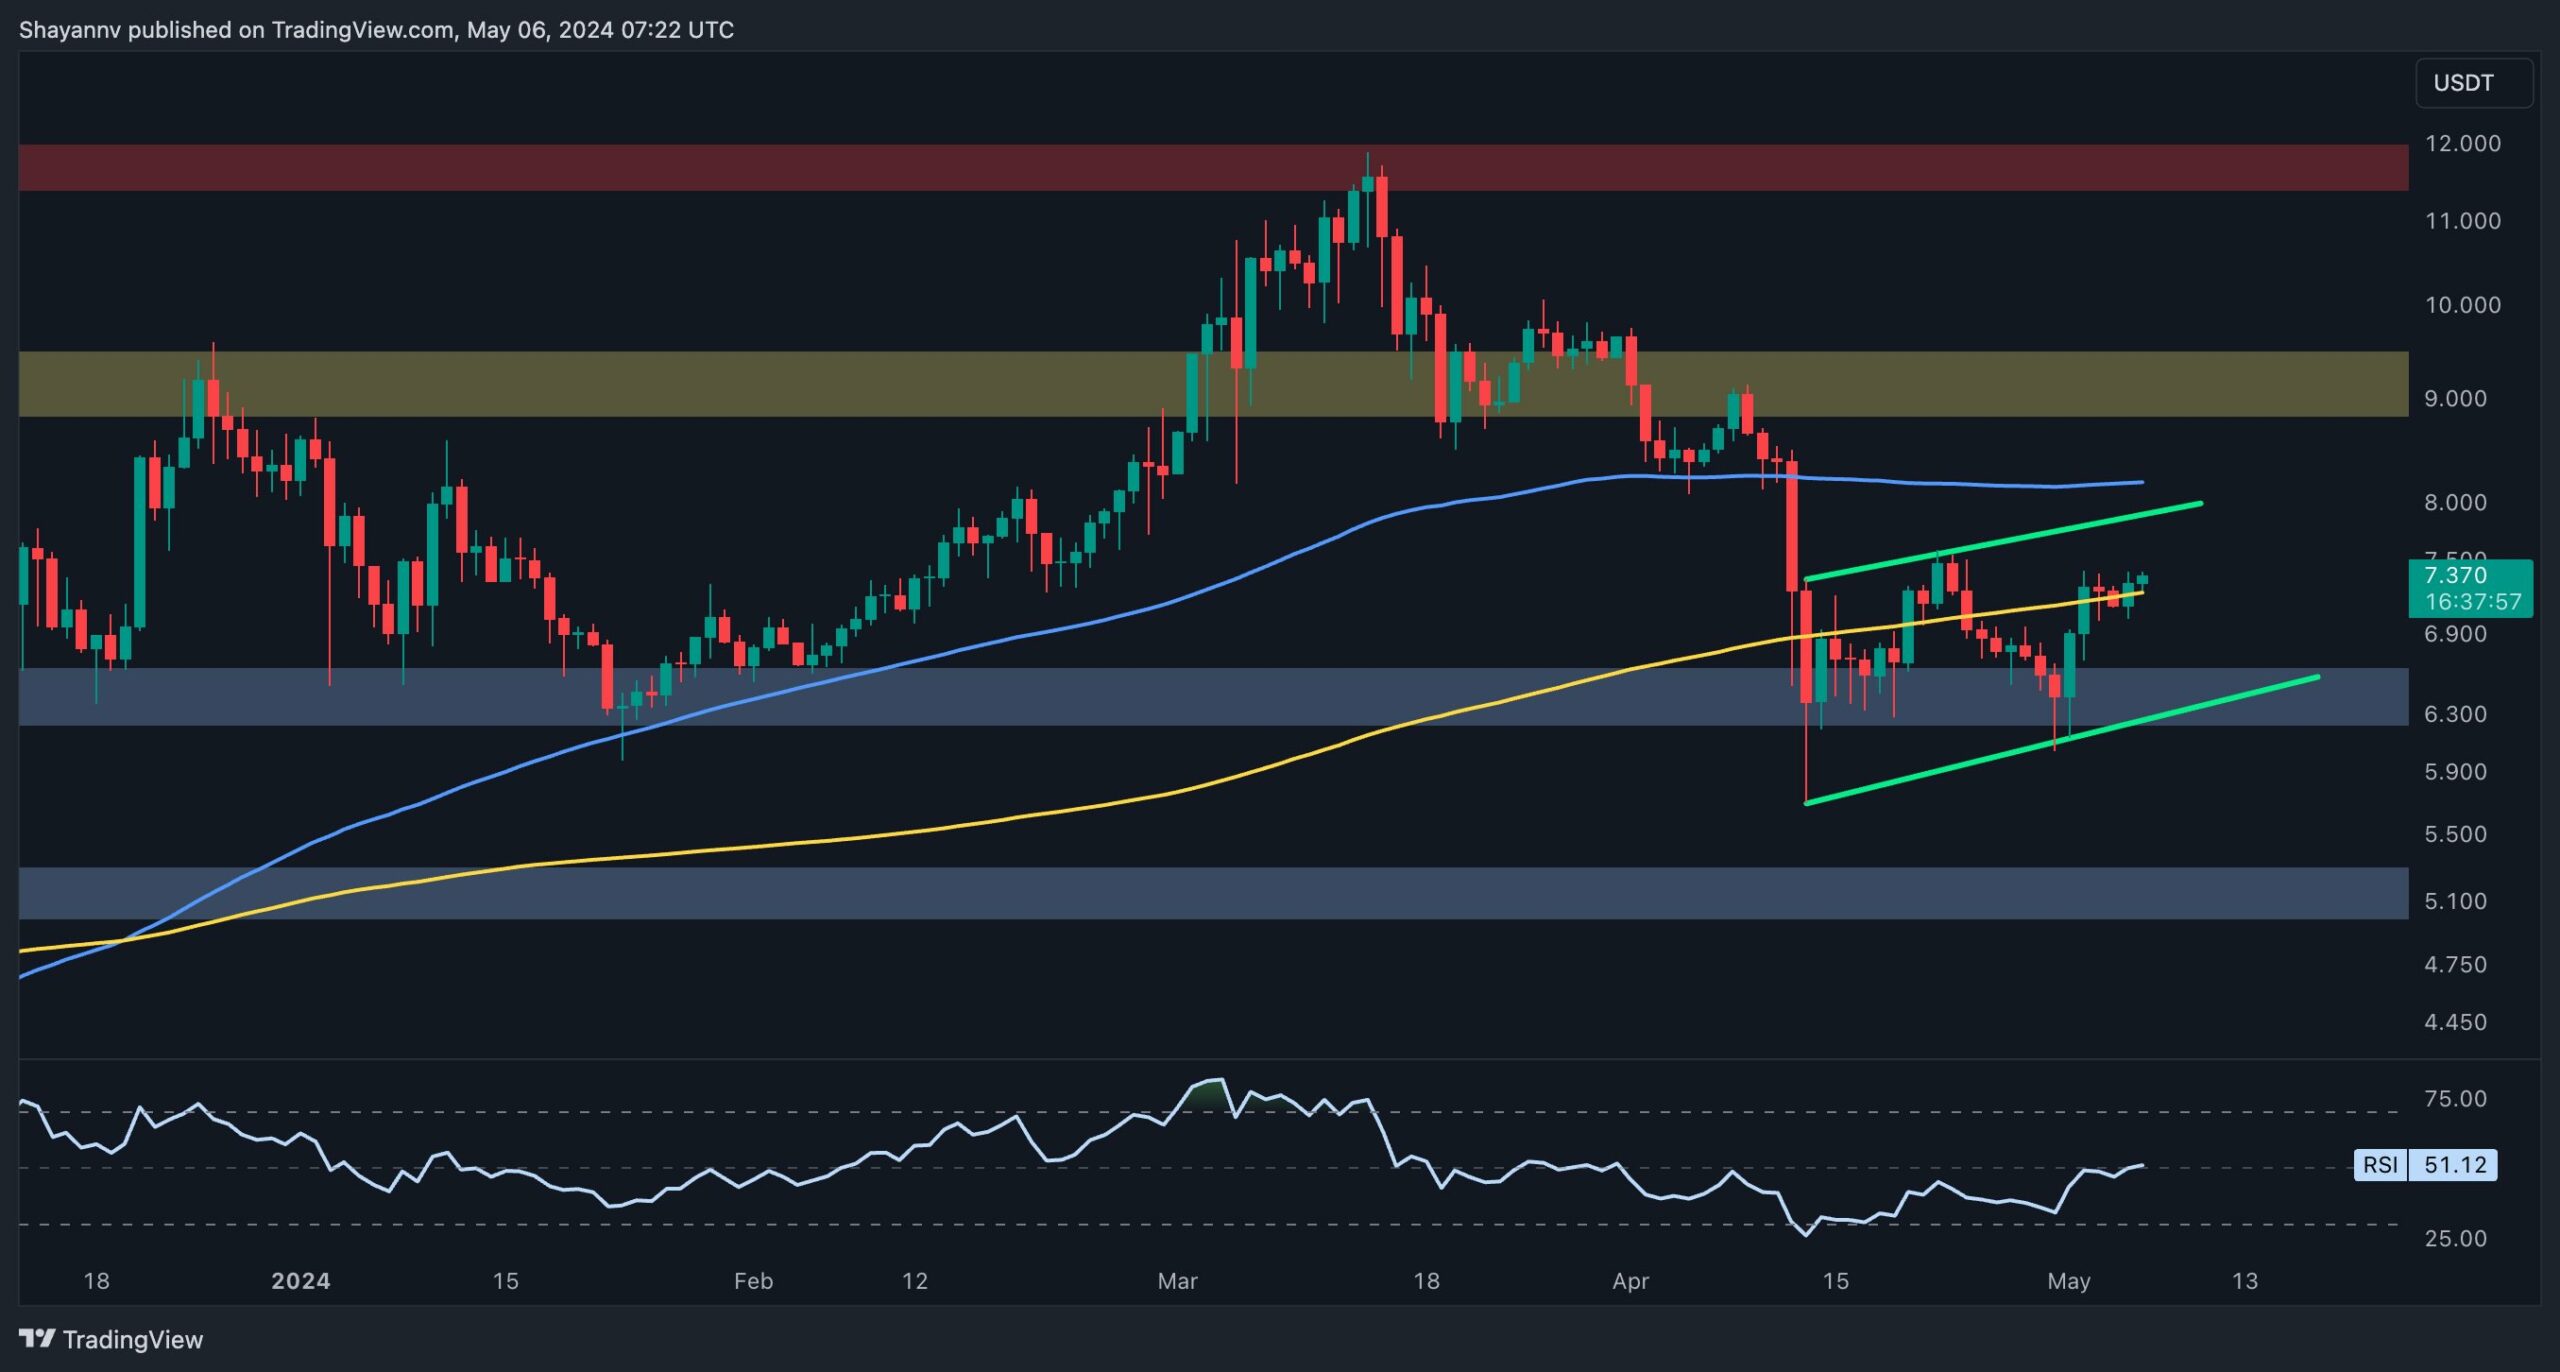
A detailed examination of the daily chart unveils a period of uncertainty and sideways consolidation near the critical $6.3 support level and the 200-day moving average.
Interestingly, the price has formed an ascending wedge pattern, a renowned bearish continuation pattern, hinting at potential seller dominance in the market.
In the event of sellers successfully breaching the wedge’s lower boundary, a significant downtrend towards the crucial $5.1 support level becomes highly probable. Conversely, a sudden bullish shift would prompt buyers to target the vital 100-day moving average, currently around $8.1, in the medium term.
The 4-Hour Chart
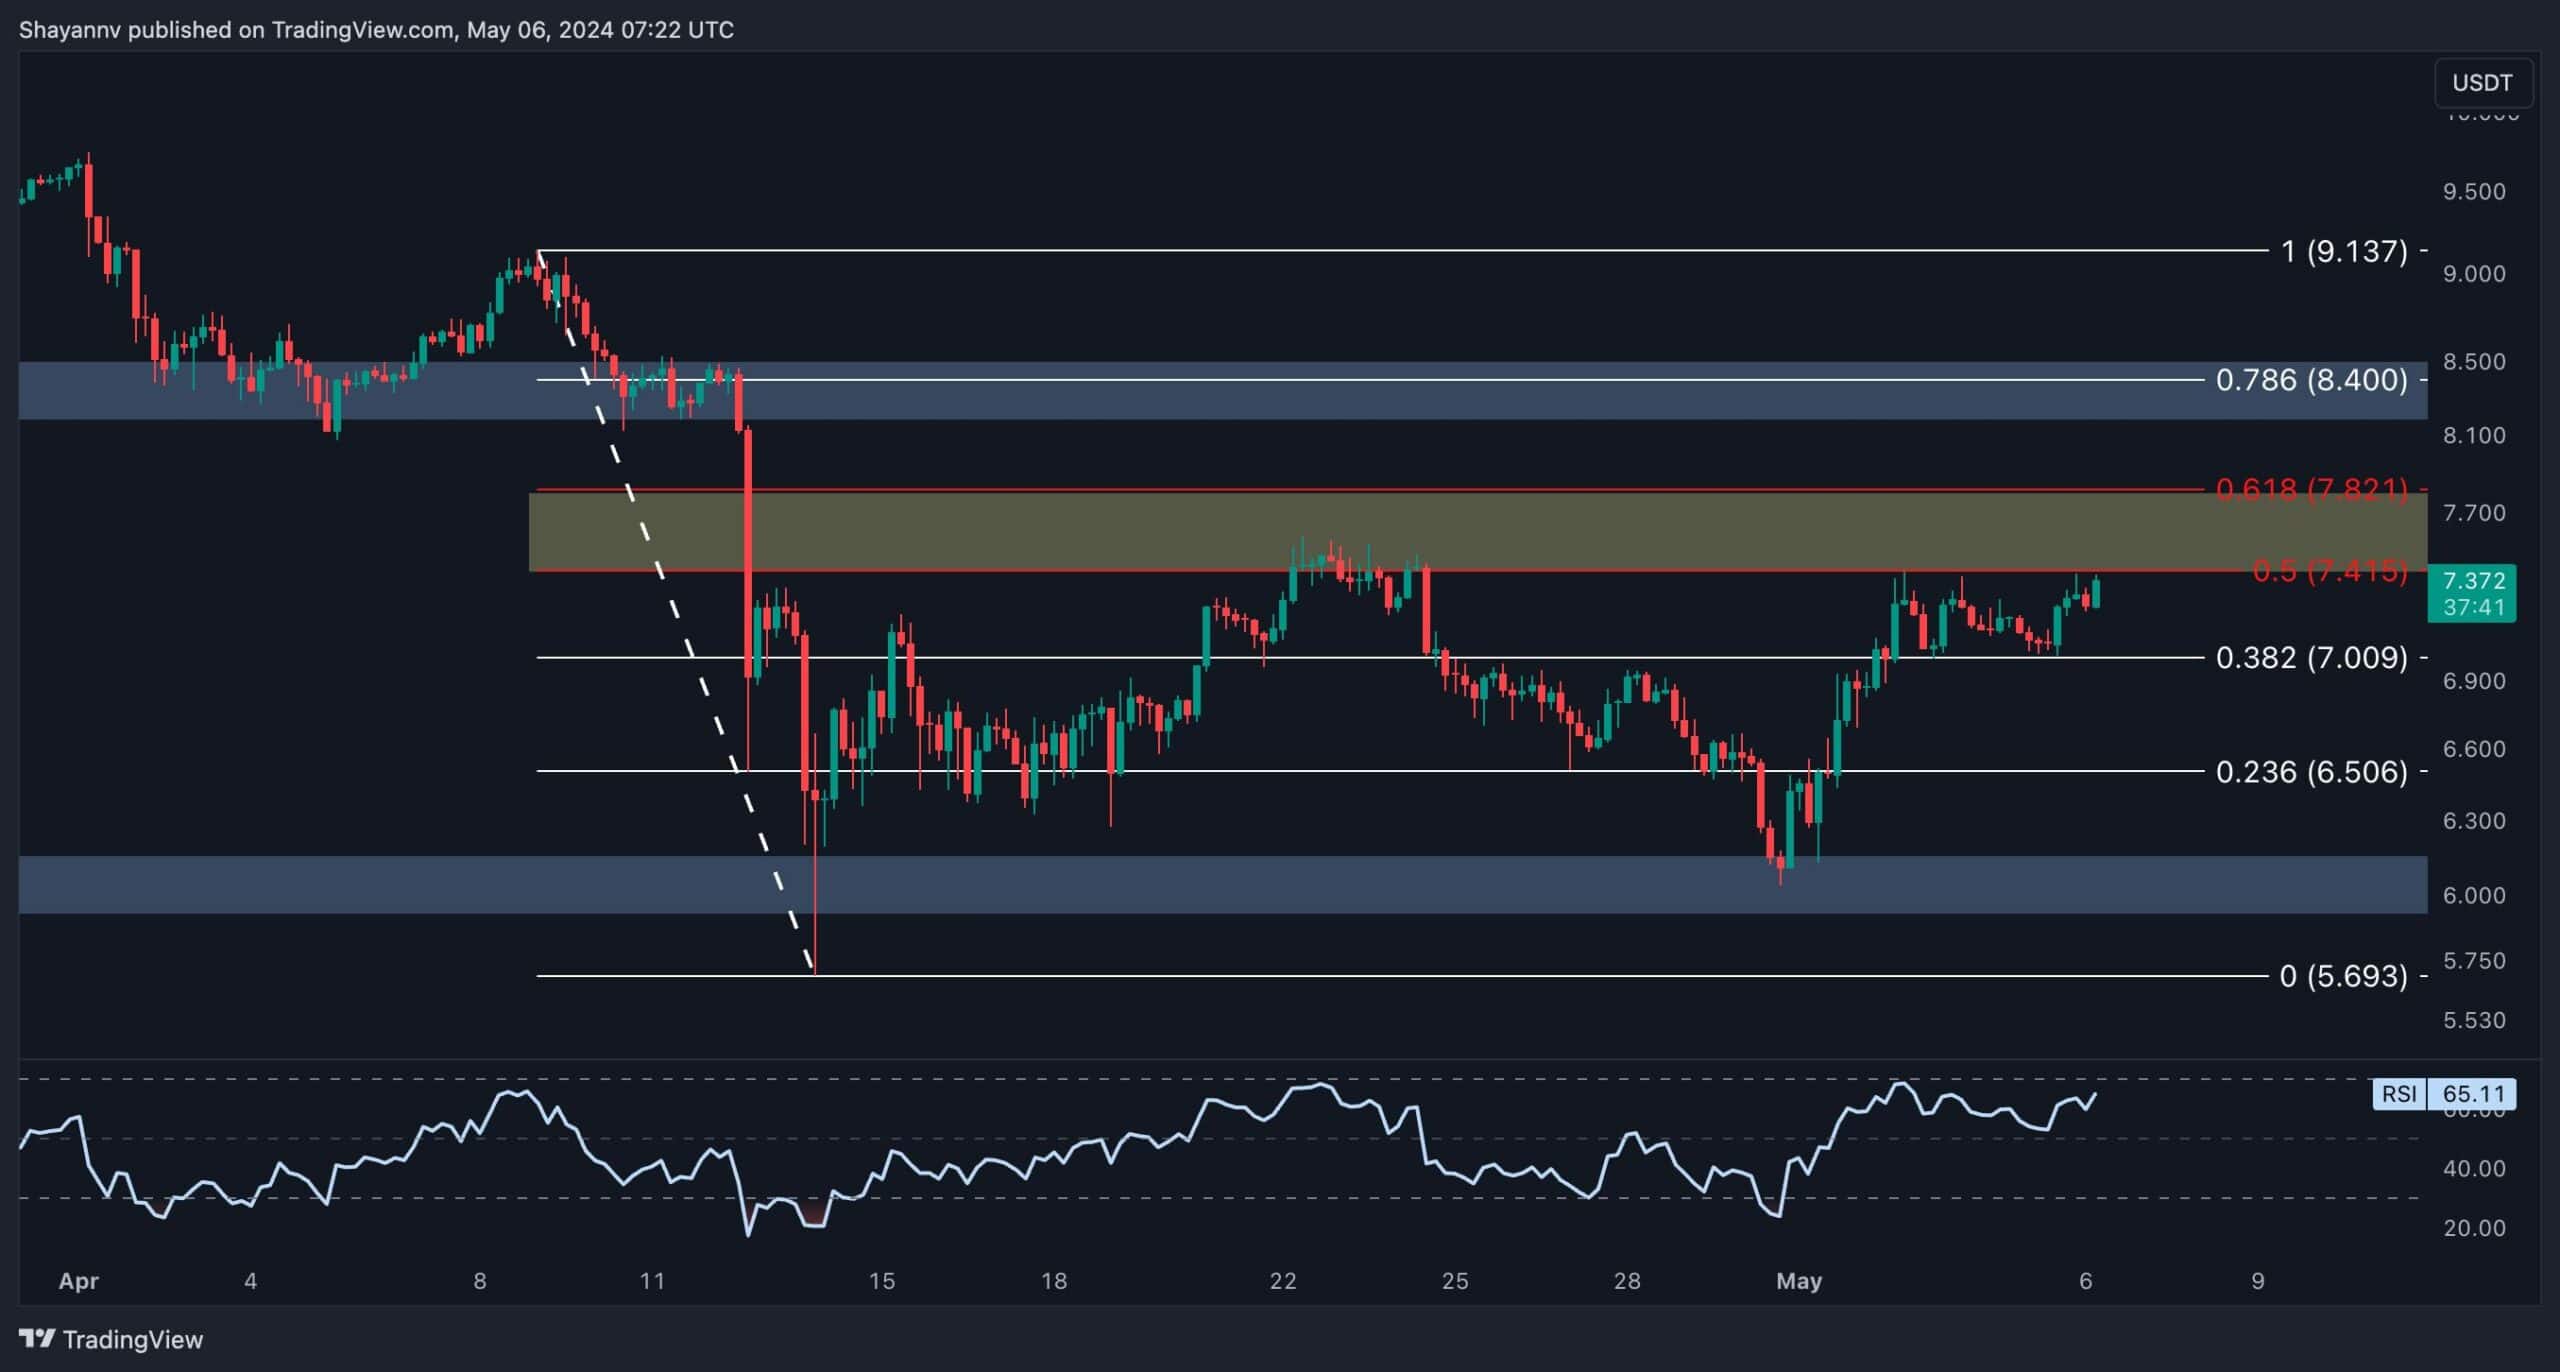
Examining the 4-hour timeframe, it’s evident that Polkadot’s recent downtrend found support near the pivotal $6 region, triggering a notable bullish reversal.
However, after a period of upward movements, the price has once again encountered the critical resistance zone defined by the 0.5 ($7.4) and 0.618 ($7.8) Fibonacci levels.
This region is accompanied by substantial selling pressure, potentially leading to another bearish rejection. Nonetheless, Polkadot’s price remains confined within a critical range, bounded by the support region of $6 and the crucial resistance at $7.4.
Price action within this range serves as the primary reference point for predicting the cryptocurrency’s future direction. However, a sudden surge above the 0.5 ($7.4) and 0.618 ($7.8) Fibonacci levels could herald a bullish resurgence in the mid-term.
Sentiment Analysis
By Shayan
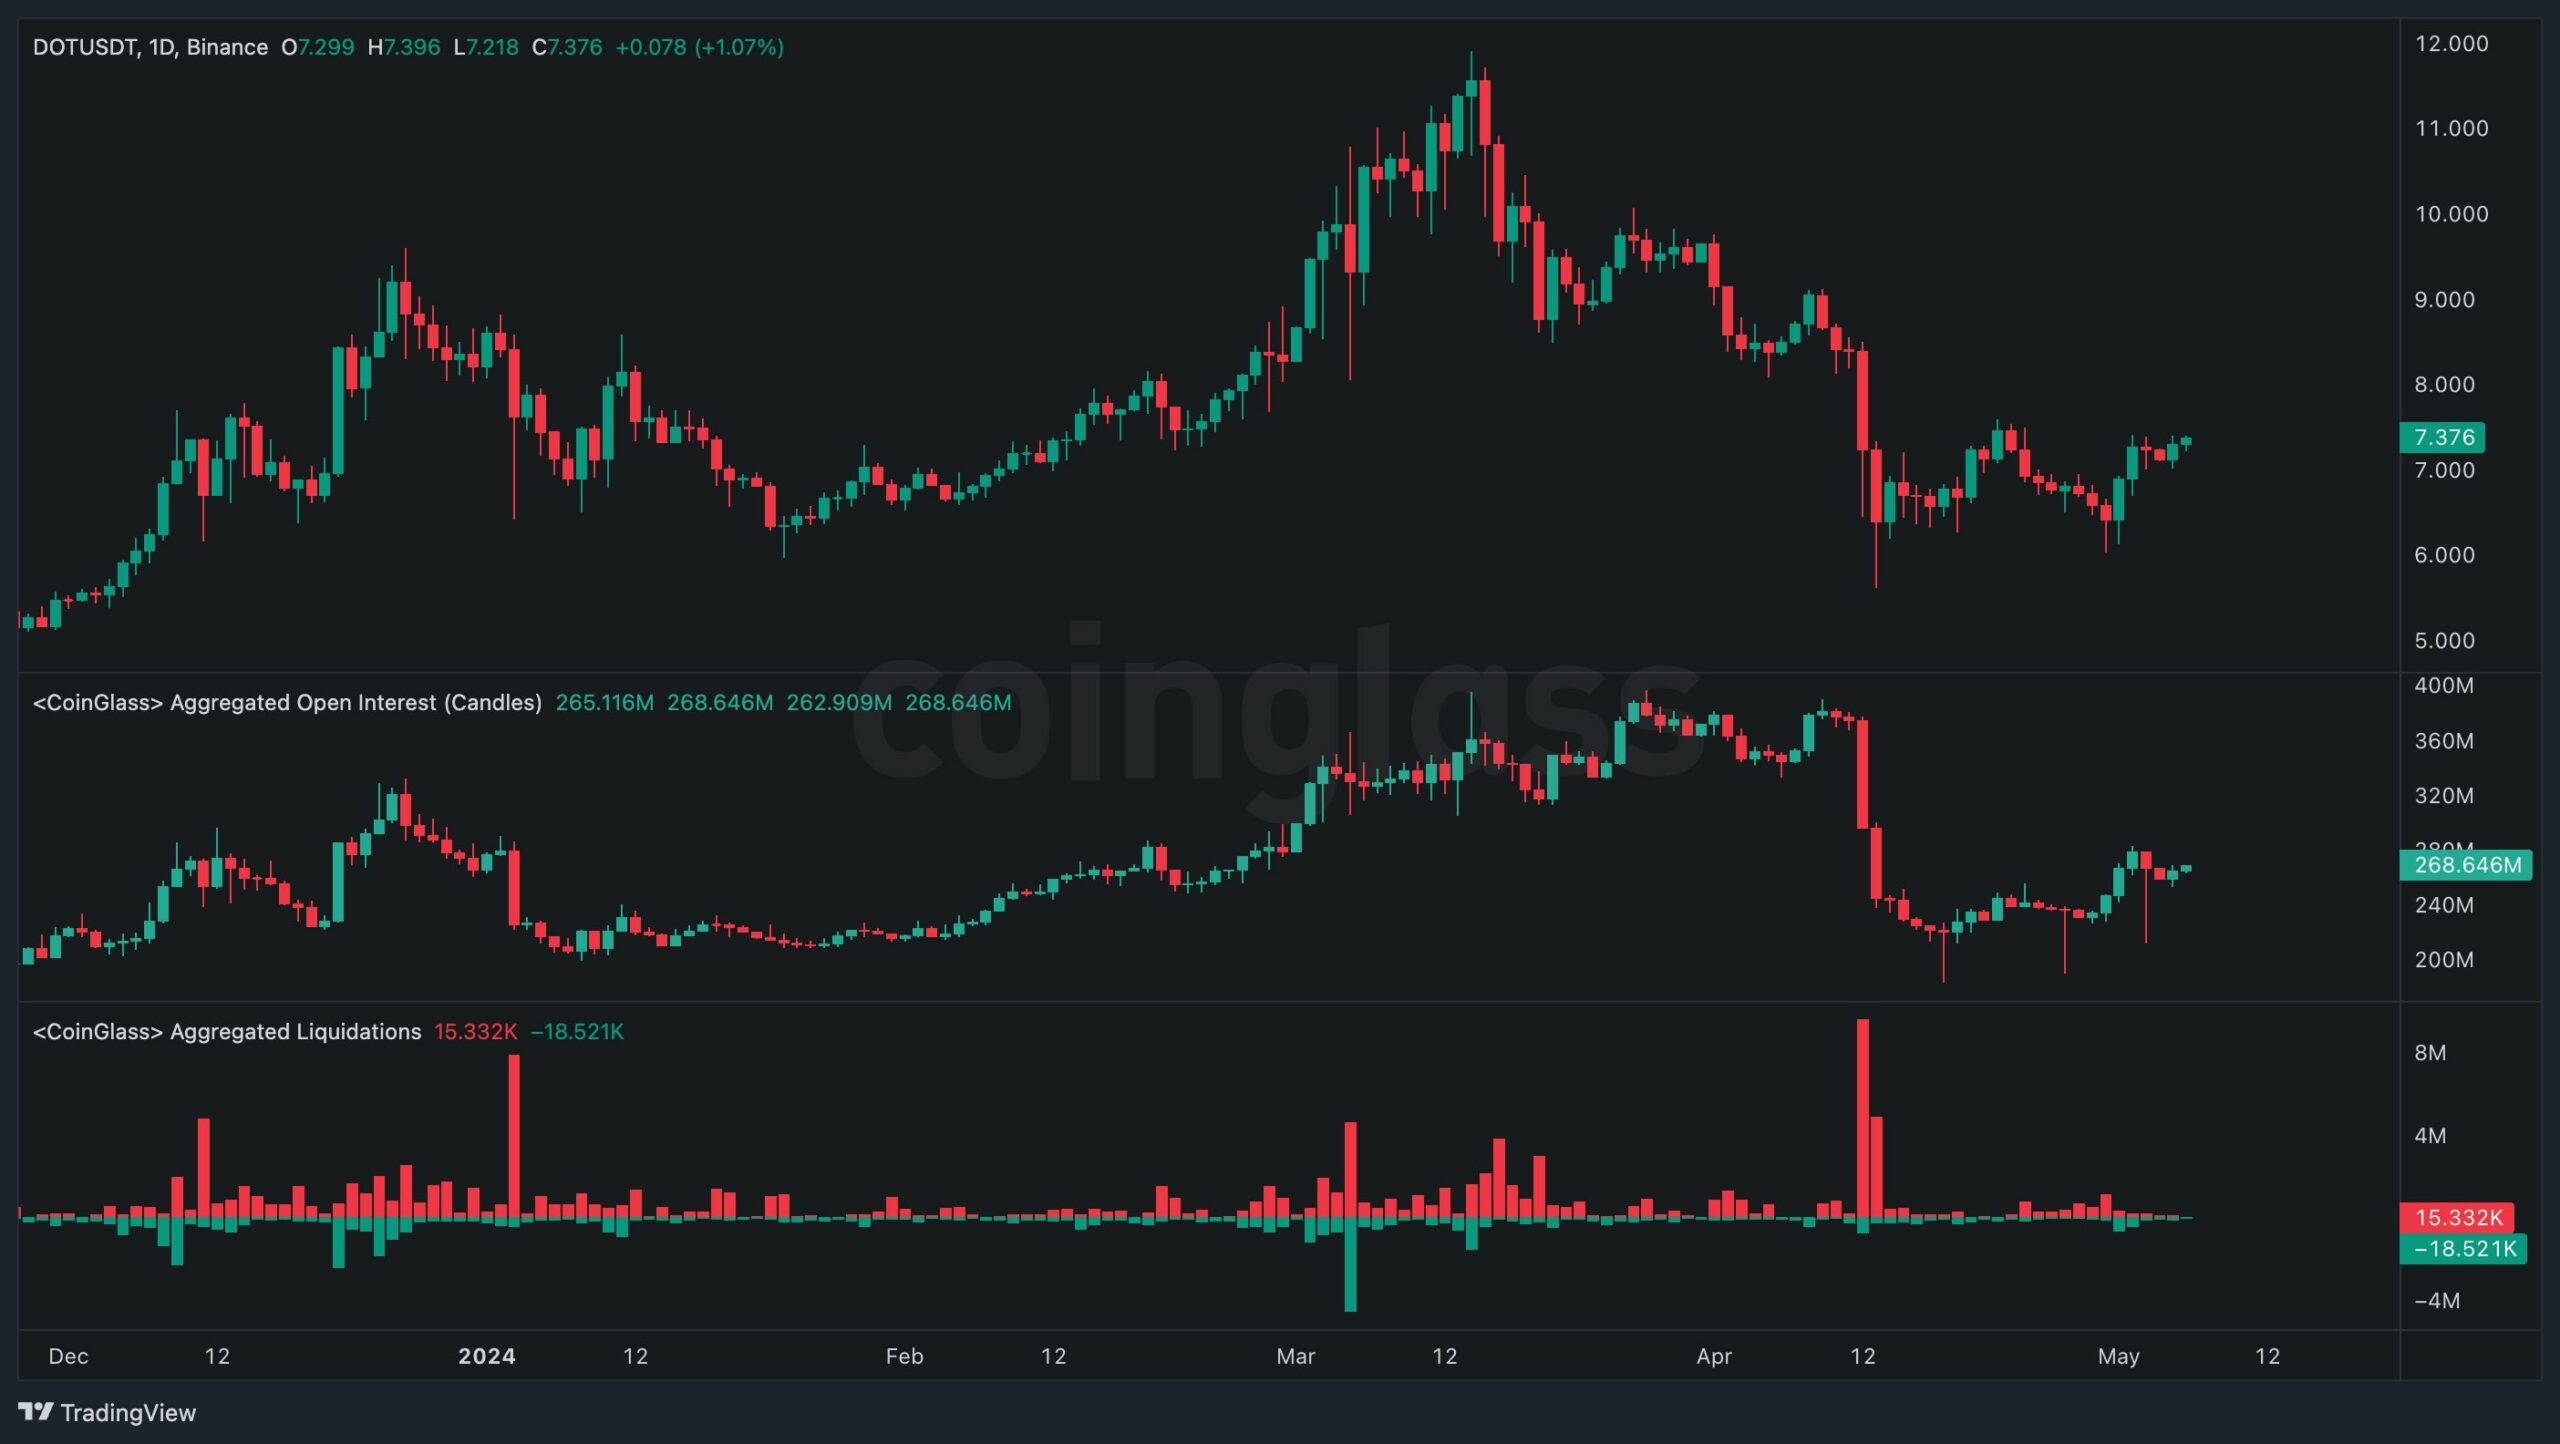
Given the recent notable downturn and the subsequent arrival at a substantial support area, traders may be keen to assess the sentiment in the futures market. The accompanying chart displays the Aggregate Open Interest and Aggregate Liquidation metrics alongside Polkadot’s price on a daily basis.
It’s important to highlight that the recent significant plummet was largely fueled by the aggressiveness of short positions. As depicted in the chart, this downturn resulted in the liquidation of a significant number of long positions, culminating in a massive long-squeeze event. Consequently, the Open Interest metric also experienced a notable decline, signaling a cooling-down phase in the perpetual markets.
Therefore, the futures market appears poised for the execution of both long and short positions, potentially leading to a significant price movement in the mid-term.
The post DOT Soars Above $7 as Buyers Are Looking at This Target Next (Polkadot Price Analysis) appeared first on CryptoPotato.


