
Hi there,
Ever thought of a straight forward way to monitor your EC2 instance metrics with Datadog but couldn’t get a simplified solution? Look no further!
The three phases to get this up and running are:
Phase one: Enable the AWS integration in Datadog
Phase two: Deploy the Datadog agent on your EC2 instance
Phase three: Start creating your monitors
Datadog agent can be installed directly on your EC2 instances which gives you the ability to collect metrics such as memory, CPU, disk etc within a short period of time.
To have a robust understanding of how this works, please visit the Datadog blog post for more detail.
Pre-requisite:
To continue with this hands-on, make sure you have the following:
EC2 instance
Datadog account
Project deep dive
For the scope of this project, we will be monitoring the following system-level EC2 metrics such as:
High CPU Utilization
High Memory Utilization
High Disk Utilization
PHASE ONE
This phase consist of enabling the AWS integration in Datadog to allow monitoring of the EC2 instance.
We will setup the Datadog integration using terraform. You can get it here.
Folder structure
——> provider.tf
——> main.tf
——> variables.tf
main.tf
data “aws_iam_policy_document” “datadog_aws_integration_assume_role” {
statement {
actions = [“sts:AssumeRole”]
principals {
type = “AWS”
identifiers = [“arn:aws:iam::${data.aws_caller_identity.current.account_id}:root”]
}
condition {
test = “StringEquals”
variable = “sts:ExternalId”
values = [
“${datadog_integration_aws.sandbox.external_id}”
]
}
}
}
data “aws_iam_policy_document” “datadog_aws_integration” {
statement {
actions = [
“ec2:Describe*”,
“ec2:GetTransitGatewayPrefixListReferences”,
“ec2:SearchTransitGatewayRoutes”
]
resources = [“arn:aws:ec2:${var.region}:${data.aws_caller_identity.current.account_id}:instance/${var.instance_id}”]
}
}
resource “aws_iam_policy” “datadog_aws_integration” {
name = “TutorialDatadogAWSIntegrationPolicy”
policy = “${data.aws_iam_policy_document.datadog_aws_integration.json}”
}
resource “aws_iam_role” “datadog_aws_integration” {
name = “TutorialDatadogAWSIntegrationRole”
description = “Role for Datadog AWS Integration”
assume_role_policy = “${data.aws_iam_policy_document.datadog_aws_integration_assume_role.json}”
}
resource “aws_iam_role_policy_attachment” “datadog_aws_integration” {
role = “${aws_iam_role.datadog_aws_integration.name}”
policy_arn = “${aws_iam_policy.datadog_aws_integration.arn}”
}
resource “datadog_integration_aws” “sandbox” {
account_id = “${data.aws_caller_identity.current.account_id}”
role_name = “TutorialDatadogAWSIntegrationRole”
}
variable.tf
type = string
description = “The AWS region to use.”
default = “eu-west-1”
}
variable “datadog_api_key” {
type = string
description = “The Datadog API key.”
default = “<REDACTED>”
}
variable “datadog_app_key” {
type = string
description = “The Datadog application key.”
default = “<REDACTED>”
}
variable “instance_id” {
type = string
description = “EC2 instance ID.”
default = “<REDACTED”
}
provider.tf
required_version = “~> 1.6”
required_providers {
aws = {
source = “hashicorp/aws”
}
datadog = {
source = “DataDog/datadog”
}
}
}
# Configure the AWS Provider
provider “aws” {
region = var.region
default_tags {
tags = {
Environment = terraform.workspace,
ManagedBy = “Terraform”
}
}
}
# Configure the Datadog provider
provider “datadog” {
api_key = var.datadog_api_key
app_key = var.datadog_app_key
api_url = “https://api.datadoghq.eu”
}
Get datadog app key, api key and api url
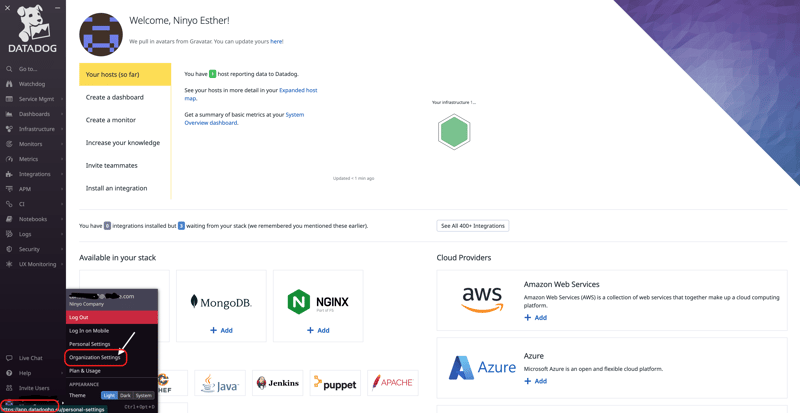
Go to your datadog profile at the bottom left and click on organisation settings.
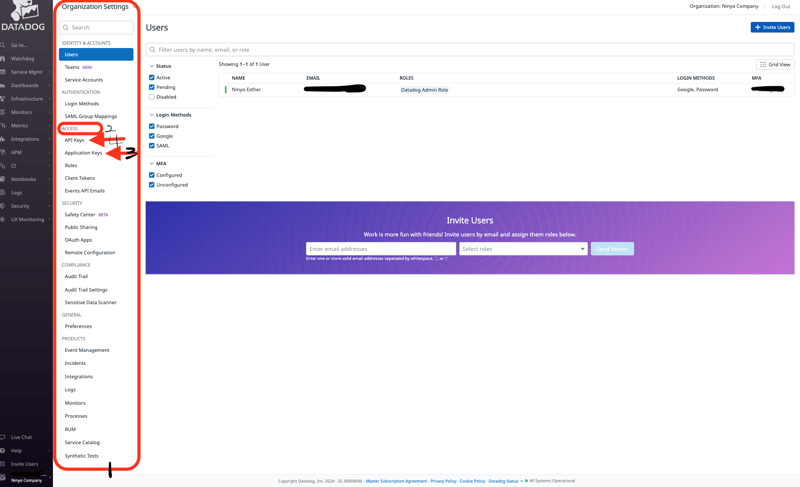
Locate the navigation pane at the left (1), under access (2), click on application key (3) to create a new key. Also click on the api key (4) to create a new key to be used.
Click on this link to access the api url depending the Datadog site you use. Replace app with api.
WHAT NEXT?
The next line of action is to initialise, plan and apply your terraform changes. To do this, use the command below in your folder home directory:
terraform init
terraform plan
terraform apply
If the terraform plan is successful, you should see the resources that will be created after running terraform apply like the result below:
data.aws_iam_policy_document.datadog_aws_integration: Reading…
data.aws_caller_identity.current: Reading…
data.aws_iam_policy_document.datadog_aws_integration: Read complete after 0s [id=1400131043]
data.aws_caller_identity.current: Read complete after 0s [id=134130342652]
Terraform used the selected providers to generate the following execution plan. Resource actions are indicated with the following symbols:
+ create
<= read (data resources)
Terraform will perform the following actions:
# data.aws_iam_policy_document.datadog_aws_integration_assume_role will be read during apply
# (config refers to values not yet known)
<= data “aws_iam_policy_document” “datadog_aws_integration_assume_role” {
+ id = (known after apply)
+ json = (known after apply)
+ statement {
+ actions = [
+ “sts:AssumeRole”,
]
+ condition {
+ test = “StringEquals”
+ values = [
+ (known after apply),
]
+ variable = “sts:ExternalId”
}
+ principals {
+ identifiers = [
+ “arn:aws:iam::<REDACTED>:root”,
]
+ type = “AWS”
}
}
}
# aws_iam_policy.datadog_aws_integration will be created
+ resource “aws_iam_policy” “datadog_aws_integration” {
+ arn = (known after apply)
+ id = (known after apply)
+ name = “TutorialDatadogAWSIntegrationPolicy”
+ name_prefix = (known after apply)
+ path = “/”
+ policy = jsonencode(
{
+ Statement = [
+ {
+ Action = [
+ “ec2:SearchTransitGatewayRoutes”,
+ “ec2:GetTransitGatewayPrefixListReferences”,
+ “ec2:Describe*”,
]
+ Effect = “Allow”
+ Resource = “arn:aws:ec2:<REDACTED>:instance/<REDACTED>”
},
]
+ Version = “2012-10-17”
}
)
+ policy_id = (known after apply)
+ tags_all = {
+ “Environment” = “default”
+ “ManagedBy” = “Terraform”
}
}
# aws_iam_role.datadog_aws_integration will be created
+ resource “aws_iam_role” “datadog_aws_integration” {
+ arn = (known after apply)
+ assume_role_policy = (known after apply)
+ create_date = (known after apply)
+ description = “Role for Datadog AWS Integration”
+ force_detach_policies = false
+ id = (known after apply)
+ managed_policy_arns = (known after apply)
+ max_session_duration = 3600
+ name = “TutorialDatadogAWSIntegrationRole”
+ name_prefix = (known after apply)
+ path = “/”
+ tags_all = {
+ “Environment” = “default”
+ “ManagedBy” = “Terraform”
}
+ unique_id = (known after apply)
}
# aws_iam_role_policy_attachment.datadog_aws_integration will be created
+ resource “aws_iam_role_policy_attachment” “datadog_aws_integration” {
+ id = (known after apply)
+ policy_arn = (known after apply)
+ role = “TutorialDatadogAWSIntegrationRole”
}
# datadog_integration_aws.sandbox will be created
+ resource “datadog_integration_aws” “sandbox” {
+ account_id = “<REDACTED>”
+ cspm_resource_collection_enabled = (known after apply)
+ external_id = (known after apply)
+ id = (known after apply)
+ metrics_collection_enabled = (known after apply)
+ resource_collection_enabled = (known after apply)
+ role_name = “TutorialDatadogAWSIntegrationRole”
}
Plan: 4 to add, 0 to change, 0 to destroy.
──────────────────────────────────────────────────────────────────────────────────────────────────────────────────────────────────────────────────────────────────────────────────────────────────────────────────────────────────────────────────────────────────────────────────────────
Note: You didn’t use the -out option to save this plan, so Terraform can’t guarantee to take exactly these actions if you run “terraform apply” now.
PHASE TWO
The second phase is to deploy the agent.
Use the command below to install the agent on ubuntu server:
where:
API_KEY = your Datadog api key
DATADOG_SITE = Datadog site. For this exercise, we use “datadog.eu”.
Depending on the operating system you use, navigate to this site to get the command for installing Datadog agent.
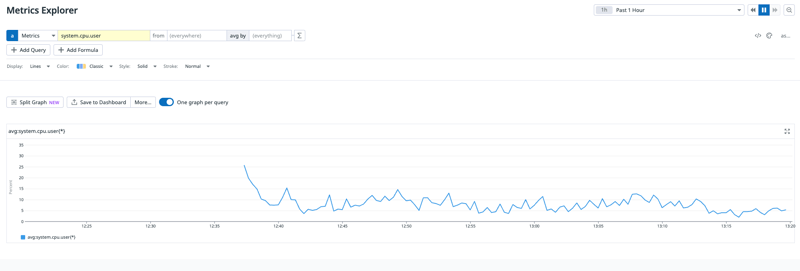
After the Datadog agent agent has been installed, go to your Datadog account, navigate to metrics and you will start to see the reports of your EC2 metrics in Datadog like the image below:
PHASE THREE
In this phase, we will create monitors for our EC2 instance for the metrics listed at the beginning of this tutorial.
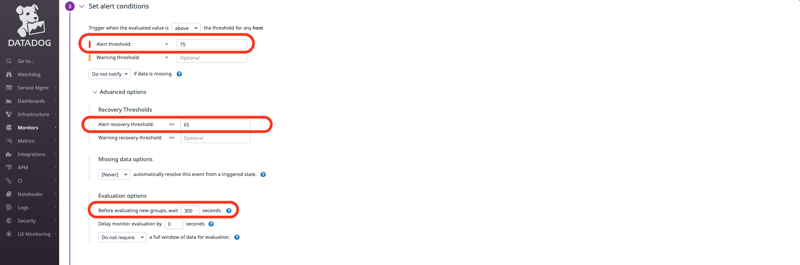
A. HIGH CPU UTILISATION
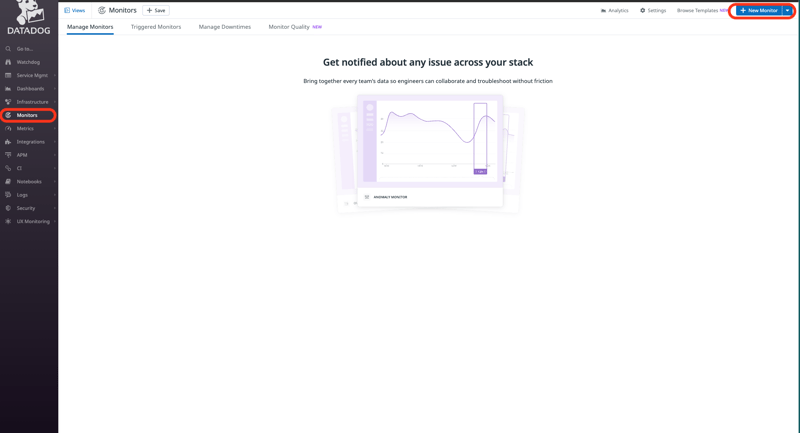
On the monitors page in Datadog, on the top right, click on new monitor
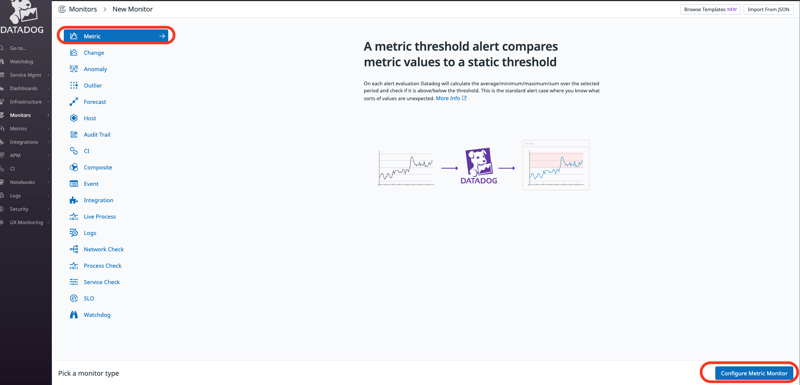
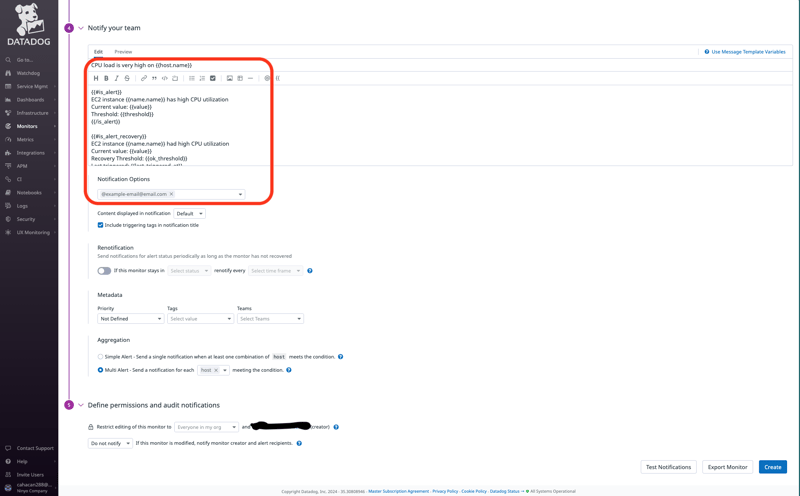
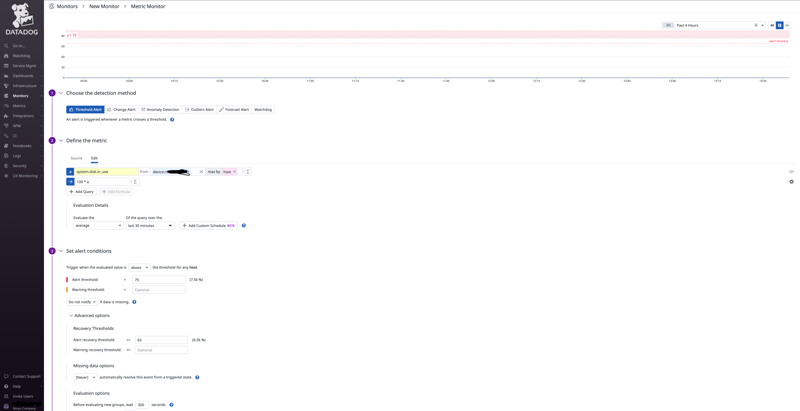
Click on metrics and configure your monitor
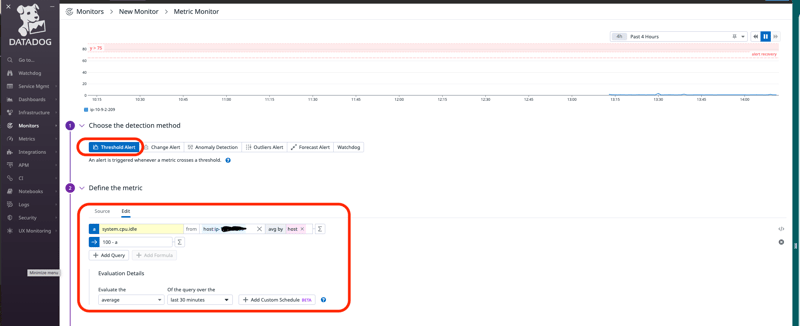
The image below shows the configuration needed to monitor your EC2 cpu utilisation
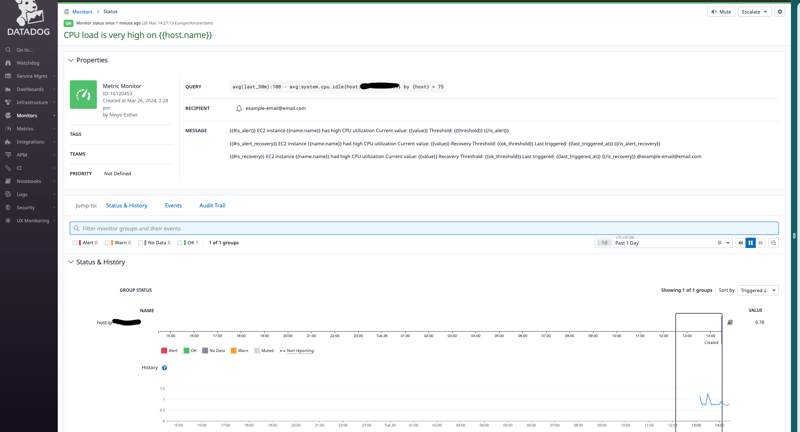
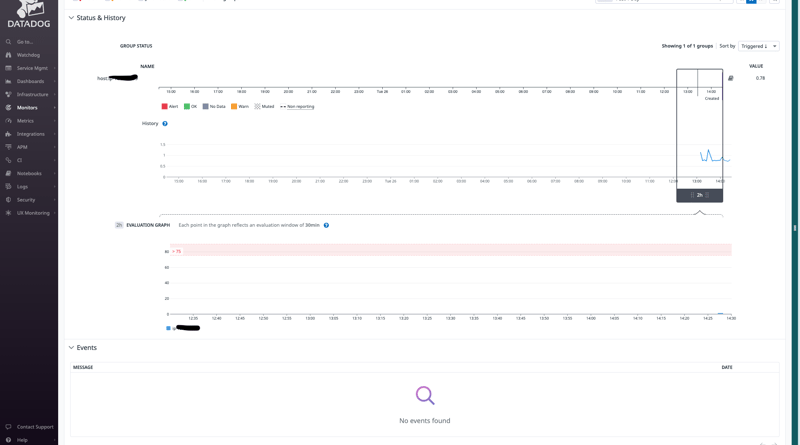
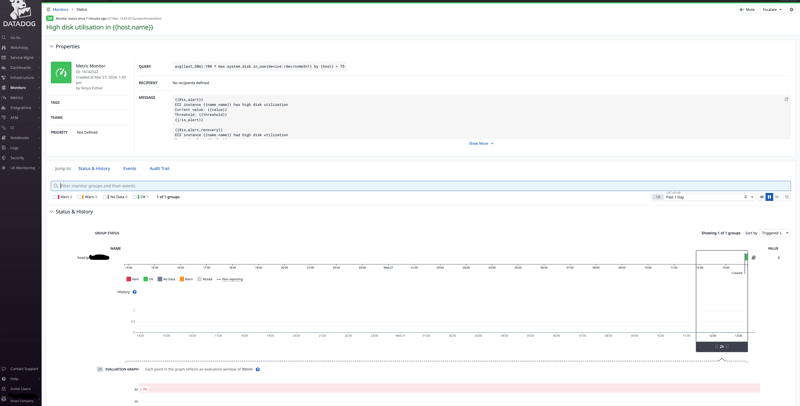
Your monitor should look like this after creation:
To understand each options used in creating the monitor, click here
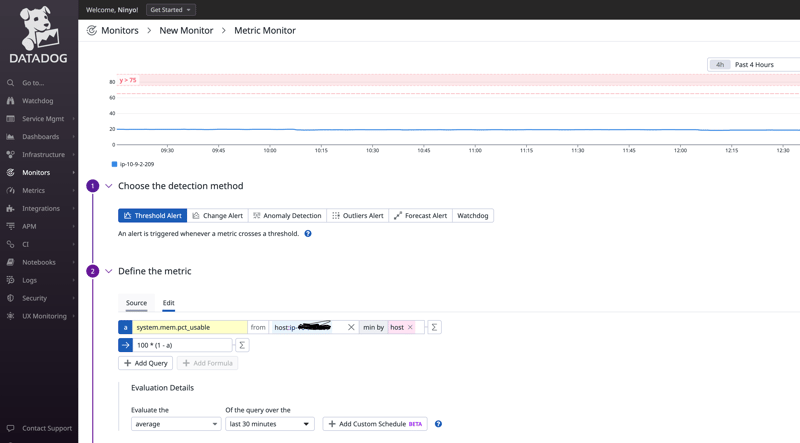
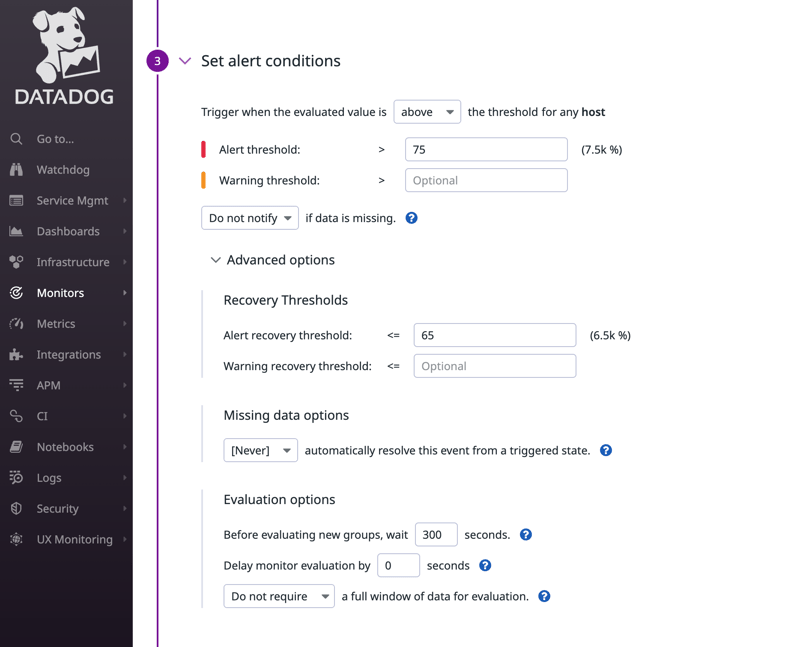
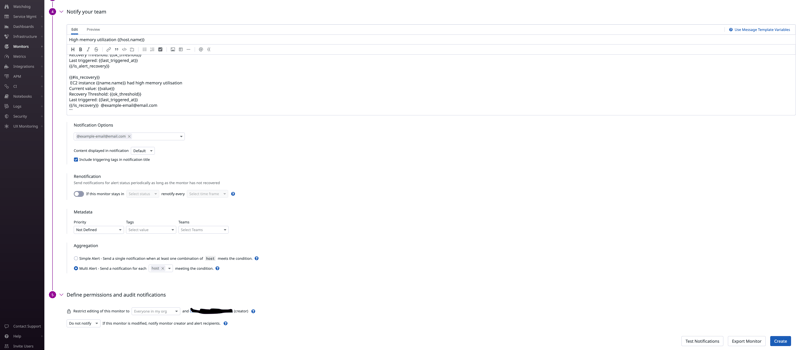
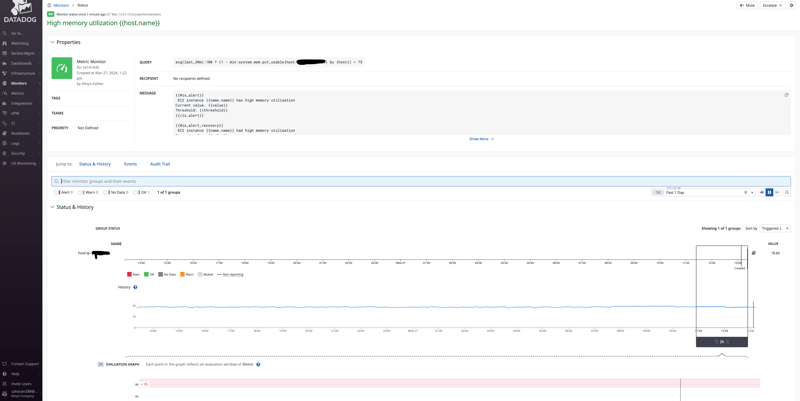
B. HIGH MEMORY UTILISATION
Your monitor should look like this after creation:
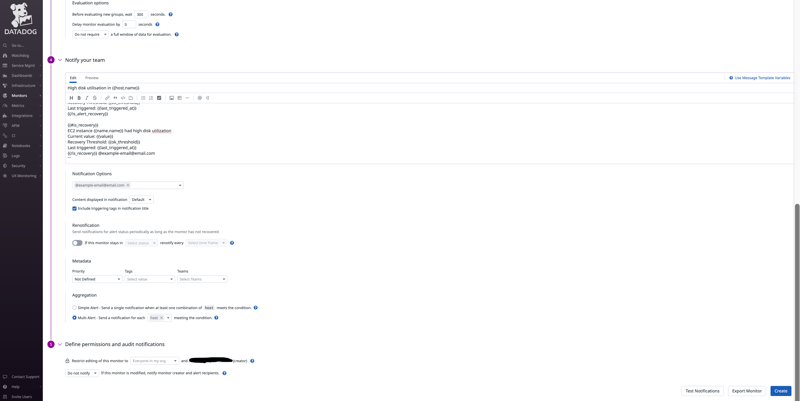
C. HIGH DISK UTILISATION
Conclusion
I hope you are able to follow through and also are able to create the Datadog monitors for your metrics. Do you have any question? Please send it my way. Kindly follow me on LinkedIn.

