
Introduction
A couple of weeks ago, I stumbled upon a challenge known as the one billion row challenge. I found it intriguing from two perspectives:
What would happen if I attempted this challenge on the front end?
Can I accomplish it?
I don’t believe we can render billions of rows onto a table, but I do think we can handle a million. That’s correct. After reading about the aforementioned challenge, I embarked on a small mini-project to render a million rows in React.
Let me provide you with a detailed account of what happened, how it happened, and why 🙂
Prerequisites
I recommend you folks to go through the below topics to have a better grasp of the topic:
Render context
Drawing basic shapes on canvas
The What?
What we are trying to build is a component that will help us to render a million rows in a ReactJs App. We make use of several techniques that are being used by other products such as google sheets and glide data grid app to achieve it.
The Why?
I explained why I did this in the above introduction section but there are more reasons for it.
I think everyone might have encountered a scenario where they use virtualization to render only the rows in the table’s viewport. This is a pretty common use case i.e. to render a lot of data via this technique.
But this technique can get slightly frisky/risky when you set the window size to be large i.e. 150 to 250 rows that need to be viewed in a single go. This tells the virtualization algorithm for these many rows to do this:
Remove all the DOM elements in the viewport
Then add the next set of 150+ DOM elements.
While doing this on scroll this operation can get pretty expensive and can bog the main thread leading to a laggy user experience.
Apart from this I also explored other tools and libraries such as:
They have done a pretty good job of rendering a million rows.
Now you know these reasons, so let us understand the uncommon way to solve this common problem.
💡 NOTE: This is a blog to explain all the key concepts required to build this project. You can have a look at the entire code in this repository.
The How?
To implement this, we will be taking the approach of drawing instead of rendering a table. In this, we will draw every data row with the help of the canvas element.
Canvas HTML element is the go-to element for any drawing stuff. Its context APIs provide many functions that can help you to draw any shape that you like.
Now we know what are we going to use, therefore let us understand the implementation steps. The implementation is divided into 3 simple parts:
Loading the Data
Initializing the Canvases
Drawing the data on a scroll
We will go into every step and understand them. To keep this blog simple, I will try to explain all the above steps visually and will keep the coding part to a minimum.
I expect that you guys can go through the code and have a look at it from the above note section.
Initializing the Project
I make use of the Reactjs project starter kit: Vite.js. It will help you to create scaffoldings for your project
I have made use of the typescript template, to do the same follow this tutorial: https://vitejs.dev/guide/#scaffolding-your-first-vite-project
Next, please refer to the repository which contains the full code for the project to familiarize yourself.
Loading the Data
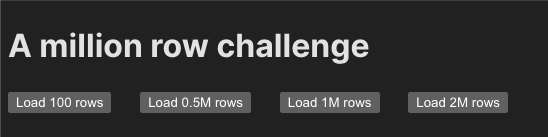
This step involves the creation of a couple of buttons that download the data from the remote source. So on the UI, we have 4 buttons that download the same data with different numbers of rows i.e. 100, 0.5M, 1M, and 2M rows respectively.
At the click of a button, the data is downloaded and parsed into an array of objects with the help of papa-parse library.
Understanding the DOM structure
Before we jump into the next steps, I would like to take a step back here and explain the DOM structure of the table that we are going to draw.
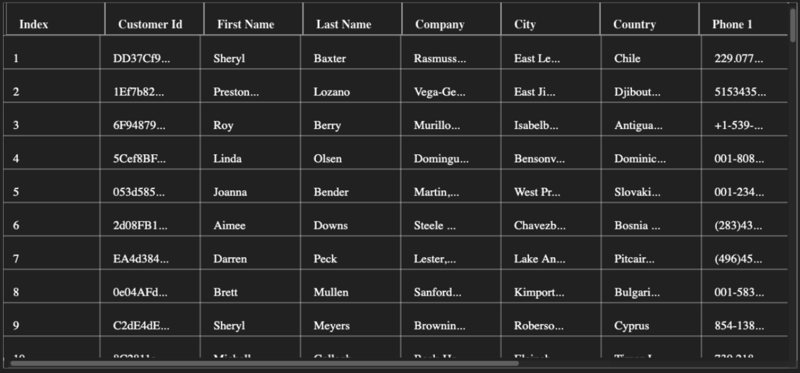
It will just look like a normal table, like below:
It just feels like a normal table with a header and rows and scrollbars.
This image of the table is divided into the following parts such that each part represents that DOM element in the project:
header-canvas – It is the canvas element on which we draw the table’s header.
target-canvas – It is the canvas element on which the table’s actual rows are drawn
scrollbar-container – It is a div element that provides the dummy scrollbar to the main-container
main-container – A div element that wraps both the header-canvas, target-canvas, and the scrollbar-container
To give the exact overview of these elements here is the gif:
You can look at the DOM structure from a code standpoint here.
Initializing the Canvases
Now that we got to know what is what, let us dive into the step of initializing both canvases. We do the following steps to initialize:
Whenever the component is mounted we initialize a web worker like below:
/**
* On component mount, initialze the worker.
*/
useEffect(() => {
if (window.Worker) {
// Refer to the Vite’s Query Suffix syntax for loading your custom worker: https://vitejs.dev/guide/features.html#import-with-query-suffixes
const worker = new CustomWorker();
workerRef.current = worker;
}
}, []);
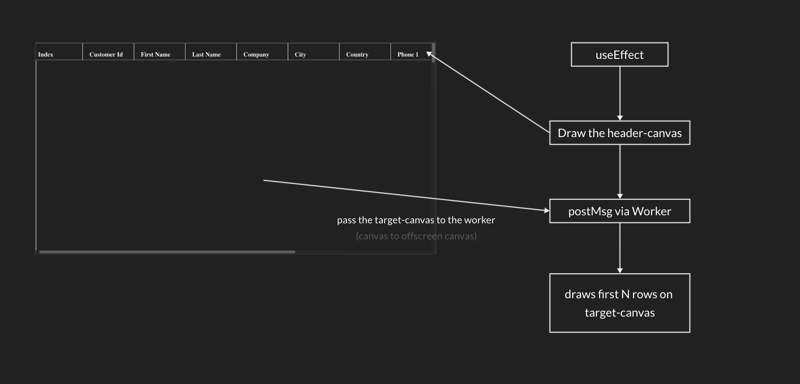
Next, when the CSV data is available we run the effect that updates the header-canvas and then pass on the target-canvas to the webworker:
/**
* This effect runs when the downloaded data becomes available.
* It has the following purpose:
* 1. Draw the table header on #header-canvas
* 2. Transfer the control to the worker
*/
useEffect(() => {
const canvas = canvasRef.current;
const headerCanvas = headerCanvasRef.current;
if (headerCanvas) {
const headerContext = headerCanvas.getContext(“2d“);
const { width, height } = DEFAULT_CELL_DIMS;
const colNames = CustomerDataColumns;
if (headerContext) {
headerContext.strokeStyle = “white“;
headerContext.font = “bold 18px serif“;
for (let i = 0; i < DEFAULT_COLUMN_LENGTH; i++) {
headerContext.fillStyle = “#242424“;
headerContext.fillRect(i * width, 0, width, height);
headerContext.fillStyle = “white“;
headerContext.strokeRect(i * width, 0, width, height);
headerContext.fillText(colNames[i], i * width + 20, height – 10);
}
}
}
/**
* We transfer two things here:
* 1. We convert our #canvas that draws the actual table to an offscreen canvas
* 2. We use the transfer the above canvas to the worker via postMessage
*/
if (workerRef.current && csvData && canvas) {
const mainOffscreenCanvas = canvas.transferControlToOffscreen();
workerRef.current.postMessage(
{
type: “generate-data-draw“,
targetCanvas: mainOffscreenCanvas,
csvData,
},
[mainOffscreenCanvas]
);
}
}, [csvData]);
A thing to note here is that we convert the target-canvas into an offscreencanvas. An offscreen canvas is similar to a canvas element but it is decoupled from the DOM. You can even create the canvas with the new keyword and pass it on to the worker.
The fun fact about offscreen canvas is that, it is also available inside the worker’s context. In this way, it also allows to use of the canvas’s context API from the worker.
In our case, we converted the target-canvas to an offscreen canvas with the help of transferControlToOffscreen function(read here). By this, If I try to draw a rect with fillRect function of the context API from the worker , then it appears here on the main canvas which is present in the DOM.
To read more about the offscreen canvas API, read here.
Pictorial Summary of What we are doing in this Step.
Big Brain Time
Buckle up, guys!! because in this section there is going to be a lot of understanding and grasping of the concepts so that you can understand the codebase in the project.
This section will talk about the entire mechanism of drawing the data onto the target-canvas while you are scrolling.
Understanding the Scrollbar-container
So first let us understand our special container i.e. the scrollbar-container that we talked about in the above section.
So a normal div element will have scrollbars if it has its width and height property to be set to x px i.e. static values along with its children’s height exceeding this parent height.
But let me ask you guys a question: Have you ever encountered a scenario where you don’t have any overflowing content inside the div but still want the scrollbars?
There are a couple of solutions like: using custom scrollbar libraries such as simplebar, or OverlayScrollbars. So even though u make use of these libs there is still a scenario of by how much height you want to scroll your container i.e. having a custom scrollable height to your div.
But how would we achieve such functionality? It’s way simpler than you think. I learned this trick when I was exploring the Google Sheets which had 0.5M rows.
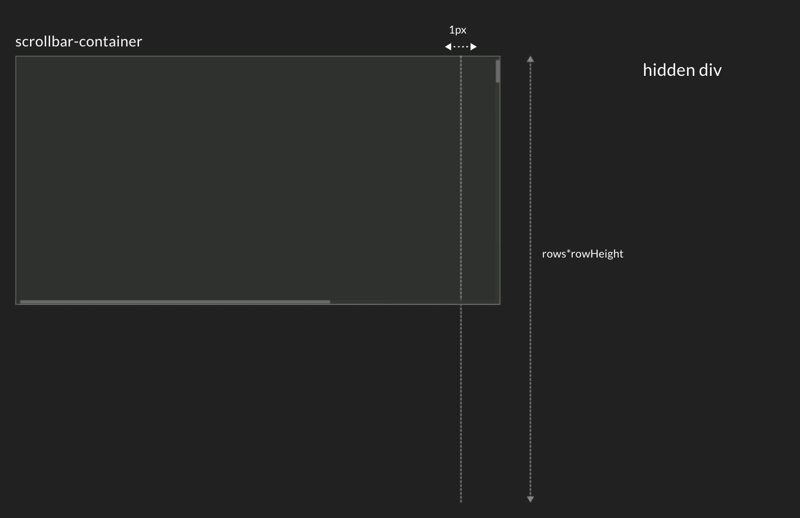
In google-sheets, they have a div element of width equal to 1px but the height of this div is equal to the data_length*rowHeight. In Google Sheets, this div was placed inside its parent container. This helped them to achieve the a custom scrollable height with the content is overflowing.
So I used the same approach of using this dummy div, with width = 1px and height = data_length*rowHeight. And this is what the scrollbar-container comprises off.
Here is the pictorial representation of the scrollbar-container:
It should be noted that this div is an hidden div i.e. visibility: hidden.
You can take a look at this scrollbar-container in the codebase here.
Understanding the Drawing Mechanism
Now we have come to the main part which is the drawing mechanism. Before we jump into this I would like to say that all the drawing onto the target-canvas happens from the worker thread. Remember we talked about initializing a worker whenever the component mounts? This is the same worker we are talking about. You can find the worker being initialized in the codebase here.
The entire drawing mechanism a.k.a the worker code can be found here.
So now we understand the it is the worker’s responsibility to draw the rows on the target-canvas therefore let us dig into its mechanism.
I would like to explain this mechanism with the help of three different approaches:
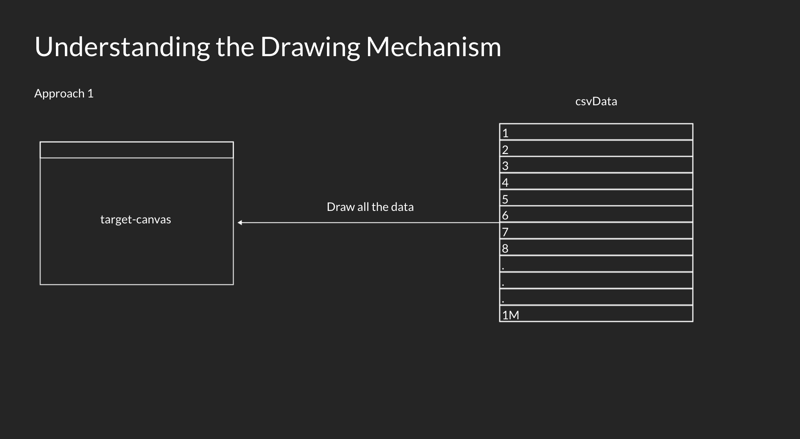
Approach 1
In this approach, once the entire data is loaded onto the memory we directly draw it onto our target-canvas.
What will happen in this case? Any guesses?
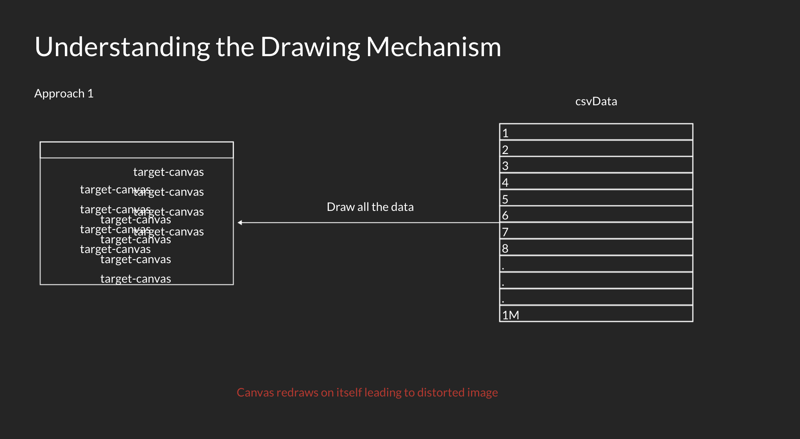
You guessed it right, all the 1M rows would get drawn onto the target-canvas overwriting the previously drawn pixels and giving us the overwritten image like below:
So as you can see the canvas is redrawn on itself leading to a distorted image. Hence this approach is bad and should not be taken.
Approach 2
In this approach, rather than drawing the entire data all at once, we draw a chunk of data onto the target-canvas. We can take a chunk size to be equal to the number of rows that can fit on the canvas.
Here is the visual representation of drawing a chunk on the canvas:
We do this as we scroll down the data and draw each chunk of rows. But there are certain things to consider before taking this approach:
To draw a row you need to draw all the cells in it equivalent to the number of columns.
Also, to draw each cell you need to:
First, clear the canvas with that cell area with clearRect.
Then to draw the cell we use [strokeRect](https://developer.mozilla.org/en-US/docs/Web/API/CanvasRenderingContext2D/strokeRect) function
Lastly, to fill the data in it we make use of the fillRect function.
All these steps happen for every cell that we draw, it is going to happen for every row and every chunk as you scroll down through the data.
This is a very expensive operation.
There is another approach that I used to achieve this without degrading the performance. Let us look into that.
Approach 3
In this approach, we make use of the offscreen canvas API. So the algorithm is as follows:
Each offscreen canvas will consist of 100 rows draw onto them from the CSV data.
These canvases are created based on the scroll position. So based on the scrollTop position, we calculate the number of rows we have scrolled off.
Based on this number we calculate the range of rows that we need to draw on the canvas. For example, if scrollTop = 150, then we select rows from 100 to 200 and draw them onto the newly created offscreen canvas.
We also generate another offscreen canvas, that draws the next set of 100 rows. From the above example, the next canvas will contain rows from 200 to 300.
We store all these canvases during the scroll in a global state in the worker which you can take a look here.
Once the canvases are ready we simply take the chunk of the current offscreen canvas and draw it as an image onto the target-canvas. Here the chunk size is the size equal to the number of rows that can fit inside the target-canvas.
When I say we take a chunk from the current offscreen canvas by that I mean we copy the chunk from that offscreen canvas as an image and draw it onto the target-canvas with the help of drawImage function. This operation is called bliting. You can find more information about it here.
To understand this visually, here is a small animation that will make things clearer:
The blue animation that you see here is the scenario where your scroll bar position intersects between the two offscreen canvases. For example, if you have completed drawing the entire 1st offscreen canvas on target-canvas then for the remaining portion of the target-canvas you will need to paint it with the exact number of rows in the next offscreen canvas.
This creates an experience of continuous data visibility while scrolling thus giving consistent experience.
So with this approach 3, you will be able to scroll normally with the mouse-wheel/touch-pad or while you are dragging the scroll bar to the bottom.
Summary
So that’s it, folks. In this blog, we learned:
How an uncommon solution like drawing on canvas solves the most common problem.
The mechanism of understanding the infinite scrolling container.
We saw how the canvas is initialized.
We also saw, the DOM structure of the component
We saw how the component gets initialized and how the control gets transferred to the worker.
Finally, we saw different approaches of drawing on the canvas when you are scrolling fast.
The entire codebase for this project can be found here: https://github.com/keyurparalkar/render-million-rows
Thank you for reading!


