
Thank you so much to @SylwiaVargas and @MelanieCrissey for their help with this guide!
Recently I participated in a LinkedIn Live Audio event about “Tech Conference Speaking: Impact and Measures”.
During the discussion, a point came up that not all developer relations professionals are working within marketing, or necessarily interact with some business and marketing “jargon”. However, it can be helpful to “speak the language” of teams like marketing or sales to have more productive cross-functional conversations and make sure your goals and priorities are aligned with these teams.
I’m pretty comfortable (maybe too comfortable 😅) with marketing and business jargon, due to my MBA in Marketing and experience working with marketing, sales, and customer success teams. Understanding these metrics can help you better understand what the overall business goals are for your company. This means you can better ensure your DevRel activities are contributing to these goals, AND help you communicate HOW they contribute.
So if you’re working in (or interested in) DevRel and only know TOFU as a food or ARR as something a pirate would say, here is a semi-comprehensive guide on some of the business and marketing terms you may come across.
TAM (Total Addressable Market)
Ideal Customer Profile/Personas
DAU/MAU (Daily/Monthly Active Users)
TOFU/BOFU (Top/Bottom of Funnel)
ARR (Annual Recurring Revenue)
New Logos
Pipeline/Opportunity
Conversion Rate
CAC (Cost to Acquire a Customer)
CLV (Customer Lifetime Value)
Churn
NDR (Net Dollar Retention)
TAM (Total Addressable Market)
This metric, measured in dollars, represents the total potential opportunity for your company if every single potential customer that could get value from your product purchased it.
This is used to demonstrate the potential value of the company overall, and is more a metric that’s helpful for investors. It can be helpful to understand though if you are tasked with supporting how much of your total addressable market you’re able to actually attain.
Ideal Customer Profile/Personas
Let’s start with personas. Personas are fictional descriptions of potential users, specifically PEOPLE users, of your product. A persona could be defined using demographic information like job role, seniority level, and technology used, but also includes traits, behavior, and motivations. Personas should be specific (“web developer” is not a persona on its own) and you shouldn’t have too many that you are targeting.
Understanding which personas your product and marketing teams are targeting can be helpful to designing resources and experiences that align with the expectations of the real people represented by the fictional personas. If your product team is building a tool designed for engineering leaders that prefer control and customization for complex use cases, but you only have opinionated getting-started tutorials for fun use cases, then you likely have a misalignment on personas.
Ideal Customer Profile refers to the qualities that make up the type of purchaser most likely to benefit from your product (and therefore pay money for it). It is usually a company, but if your product is also used by individuals it could be a solo dev or entrepreneur.
ICP as a company is primarily relevant for products designed for businesses, which most developer tools are. While personas are based on demographics and human traits, ICPs are based on firmographics, things like company size, industry, organizational structure, and annual revenue. Knowing your ICP can be helpful when planning events and content as a DevRel team. Based on your ICP, you may target events that are more likely to have attendees that work at startups vs enterprises, for example.
DAU/MAU (Daily/Monthly Active Users)
If your company is focused on user growth and consistent usage of the product, you may need to track Daily or Monthly Active Users. This is the number of users that interacted with your product in a given time frame.
This is important if users get more value (or spend more money) based on how often they use your product. If your product is an analytics dashboard and you have 100,000 users, but only 5 active users checking the dashboard on a given day (5 DAUs), that could definitely be a problem.
However, if your product is an SDK that is integrated once per project, it wouldn’t make sense to track this metric, as developers don’t need to interact with your SDK on a daily or even monthly basis to get value.
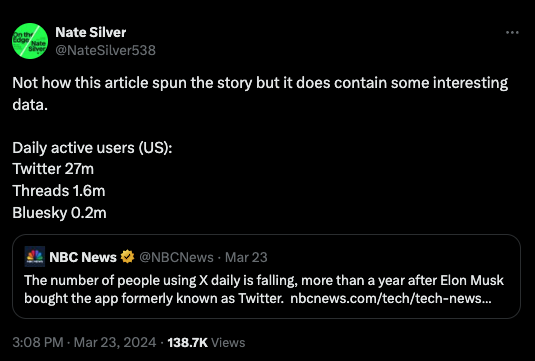
DAU/MAU metrics can signal a growing, active community for your product. You will often see social media or mobile app products use DAU/MAU metrics. For example, this tweet about DAUs for various social media sites:
TOFU/BOFU (Top/Bottom of Funnel)
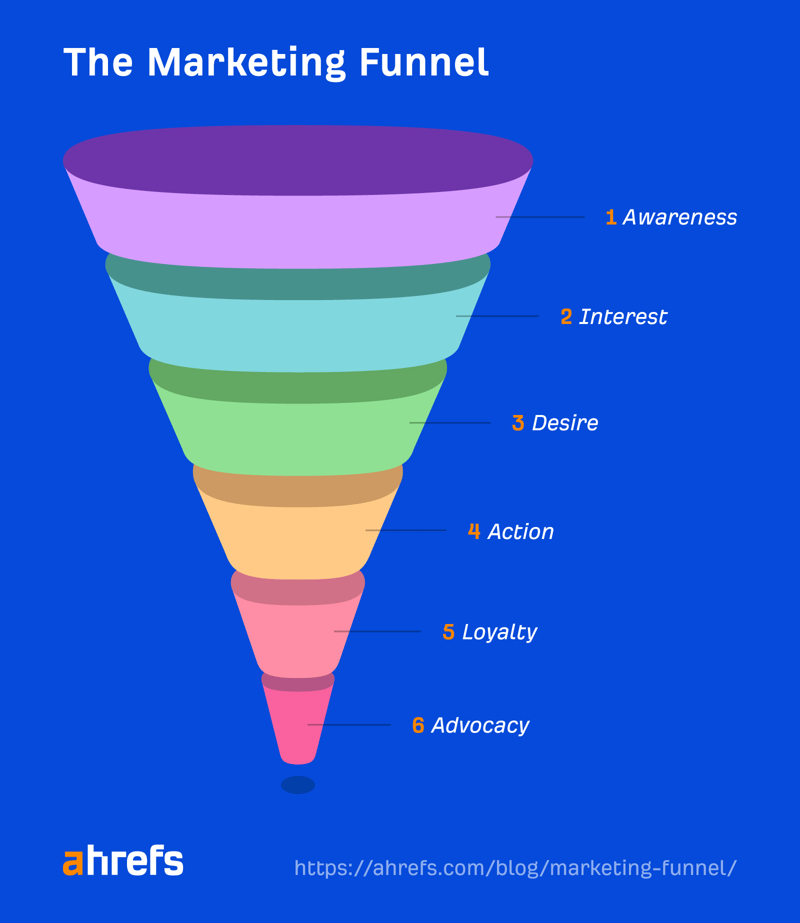
Both these terms are related to the concept of the “sales funnel”, or also called the “marketing funnel”. The sales funnel is a metaphorical journey that potential customers move through.
Some sales funnels end when the customer makes a purchase, however I prefer funnels that also include stages for ensuring customers stick around (loyalty) and even refer others to your product (advocacy).
It’s described as a funnel to represent that there are much more potential customers at the beginning of the process (the wide open Top of the Funnel), but then prospects drop off during the journey, and you end up with much fewer actual paying customers (the narrow spout at the Bottom of the Funnel).
Imagine you start with 100 developers that have just found out about your product for the first time. This is the VERY top of the funnel. 20 drop off because they don’t have a need for it. Then another 30 drop off because their project isn’t a good fit. The remaining 50 are further in the funnel, and are evaluating the product. They dig around the pricing page, try out your “hello world”, maybe get a demo from sales. Another 30 drop off here for various reasons, but 20 convert to paying customers. Sweet! Unfortunately, 10 cancel their account within the first year. So you have 10 left at the bottom of the funnel.
Now the company needs to keep these 10 as customers and encourage them to increase their spend with more users or other upgrades. You may even encourage these customers to refer others through ambassador or partner programs.
This is the bottom of the funnel. The idea is that you need to fill the funnel as much as possible at the top to get the number you need at the bottom, because you’ll lose most along the way.
You may also see “MOFU”, or “middle of funnel”. This can be helpful if you have a longer, more complex funnel and want to specify steps in the middle of that process vs. just top and bottom.
To recap:
TOFU: Activities where the goal is to attract many potential customers to the beginning of the sales process. These are awareness-driving activities to reach developers who have never heard of your product before.
MOFU/BOFU: Activities that are designed to encourage free users to convert to paying customers, OR to get existing customers to expand their current usage. These could be things like tutorials for advanced use cases or supporting your community of developers.
ARR (Annual Recurring Revenue)
This is a term used by SaaS (or other XaaS) companies, otherwise known as companies that have a subscription model for their software or infrastructure product. It is the amount of money expected to come in during the year from subscriptions. Broken down:
Revenue: money coming in
Recurring: money coming in that is repeated, not a one-time purchase
Annual: Repeated money coming in over the course of a year
For most companies past seed stage, ARR is going to be the most important metric that all other goals roll up into.
You may see some variations, including “new ARR”, which refers to ARR only from new accounts in a given time frame, or “total ARR”, which includes new and existing customers.
New Logos
This isn’t necessarily a metric, but a phrase you may see. It refers to the number of new customers brought on, but specifically business customers (hence the term “logo”, because companies have logos). This could be a vanity metric, but often will be used to legitimize the product, especially if the logos are well-known, reputable companies.
Sometimes, your sales team may negotiate to use the business customer’s logo on your website. Other times there may be a reference like “trusted by thousands of companies” or “used by Fortune 100 companies” in your marketing. Internally, it could be used by sales teams to signal growth, or there could be a goal to sign 50 new logos in a year, for example.
Pipeline/Opportunity
These terms are typically used by managed sales teams to represent the potential incoming sales amount measured as a dollar value. By managed sales, I mean typically larger enterprise deals that are moved along through the sales process by an account executive.
An opportunity is calculated based on the expected dollar amount of the sale (opportunity size) adjusted by the probability the deal will actually close. Typically the probability increases the further along the sales process.
The pipeline refers to the total sum of all the probability-adjusted opportunities currently active and waiting to close.
Sometimes, DevRel activities can be attributed to specific opportunities. For example, if you give a demo at a conference booth or create a piece of content that results in a sales lead. Some DevRel teams may track influenced opportunities or even total influenced pipeline.
Conversion Rate
This is the percentage of free users that convert to a paid account. This can be helpful to understanding a few things:
Does your product provide value users feel is worth paying for?
Are you bringing the right users into your pipeline?
Are there blockers (technical, pricing, marketing) that keep your users from upgrading to paid?
For example, if you are able to attract 1000 free users, but only 1 ends up paying you, that represents a conversion rate of 0.1%. A low conversion rate can be a sign of trouble with your product or developer journey, or that you may be targeting the wrong personas.
CAC (Cost to Aquire a Customer)
This is the amount a company spends to bring on a new customer. It is typically calculated by taking the total spend on customer acquisition (sales, marketing) and dividing by the number of customers acquired. So if you spend $100k and acquire 100 customers, you are spending $1000 to acquire a single customer. The amount spent on DevRel activities rolls up into the CAC. The goal is to keep this number as low as possible, but definitely lower than the customer lifetime value, which we’ll cover in a moment. This metric may become important to you as a DevRel professional if it’s too high. You may have a harder time justifying budget spend or may need to explore alternative solutions for bringing on customers that cost less.
CLV (Customer Lifetime Value)
This is the amount of money spent by a customer over their lifetime as a customer. Let’s say you bring on a customer and they have the following spend:
Year 1: self-serve individual plan, $120 ARR
Year 2: upgrade to self-serve team plan, $600 ARR
Year 3: upgrade to enterprise plan, $5k ARR
Year 4: expand plan and adds more users, $8k ARR
Year 5: customer churns, $0 ARR
The CLV is $13,720. So if you spent $1k to acquire this customer, you wouldn’t see a return on your investment until year 3, but overall would more than out-earn the CAC. This is why preventing churn is so important, because if a customer churns too early, it severely limits the CLV and overall return on investment to acquire that customer.
Churn
Churn is another word for cancellations, represented as a percentage rate. Meaning, what percentage of customers who subscribe end up canceling their account? Preventing churn is typically a key focus for Customer Success teams, but preventing churn should be the responsibility of all teams that interact with users, including DevRel. If churn is high, it’s important to understand why, and how a cross-functional team like DevRel could help.
Are there insufficient resources for users to be successful with the product? Does the product not work as expected? Is feedback from users getting back to the product team to make improvements? Does the user community need more support?
It’s more expensive to bring on a new customer than to retain an existing one. So if you are great at bringing in users but have high churn, your CAC will be too high and CLV too low, making it much more difficult to achieve profitability for the business.
NDR (Net Dollar Retention)
One more metric that is related to CLV and churn is Net Dollar Retention. This term refers to how much of each dollar you bring in is retained over time. It is a percentage and can be impacted negatively by churn or downgrades and impacted positively by upgrades or other expansions.
For example, if you bring in $100k in base ARR in one year but:
$20k is lost through churn/downgrades
$15k is brought in through upgrades/expansions
You have retained $95k of the $100k, resulting in a 95% NDR.
As you can imagine, a positive NDR is ideal, and if not, then as close to 100% as possible. Again, this metric is typically important to Customer Success teams, but could be related to activities related to DevRel, such as community engagement.
Recap
This list addresses some of the most common terms you’ll hear across the developer journey, as well as across different functions in your organization. It is by no means comprehensive, but should give you a good initial grasp on the business vocabulary and concepts you’ll encounter in DevRel when collaborating with other teams. Every company approaches DevRel differently, so you may end up focusing on some metrics more than others. I’d recommend setting up meetings with team members in Marketing, Sales, and Customer Success to better understand what metrics are important to them, and get a sense of how your goals as DevRel can work complementary to their efforts.
Did I miss any terms? Any of these that should be retired? Let me know in the comments!


