
Following a notable rejection at the substantial $4K price level, Ethereum underwent a corrective phase, experiencing a significant 25% decline. However, as the price neared the significant support of the 0.618 Fibonacci level, a rebound occurred, suggesting the potential for an impulsive surge.
Technical Analysis
By Shayan
The Daily Chart
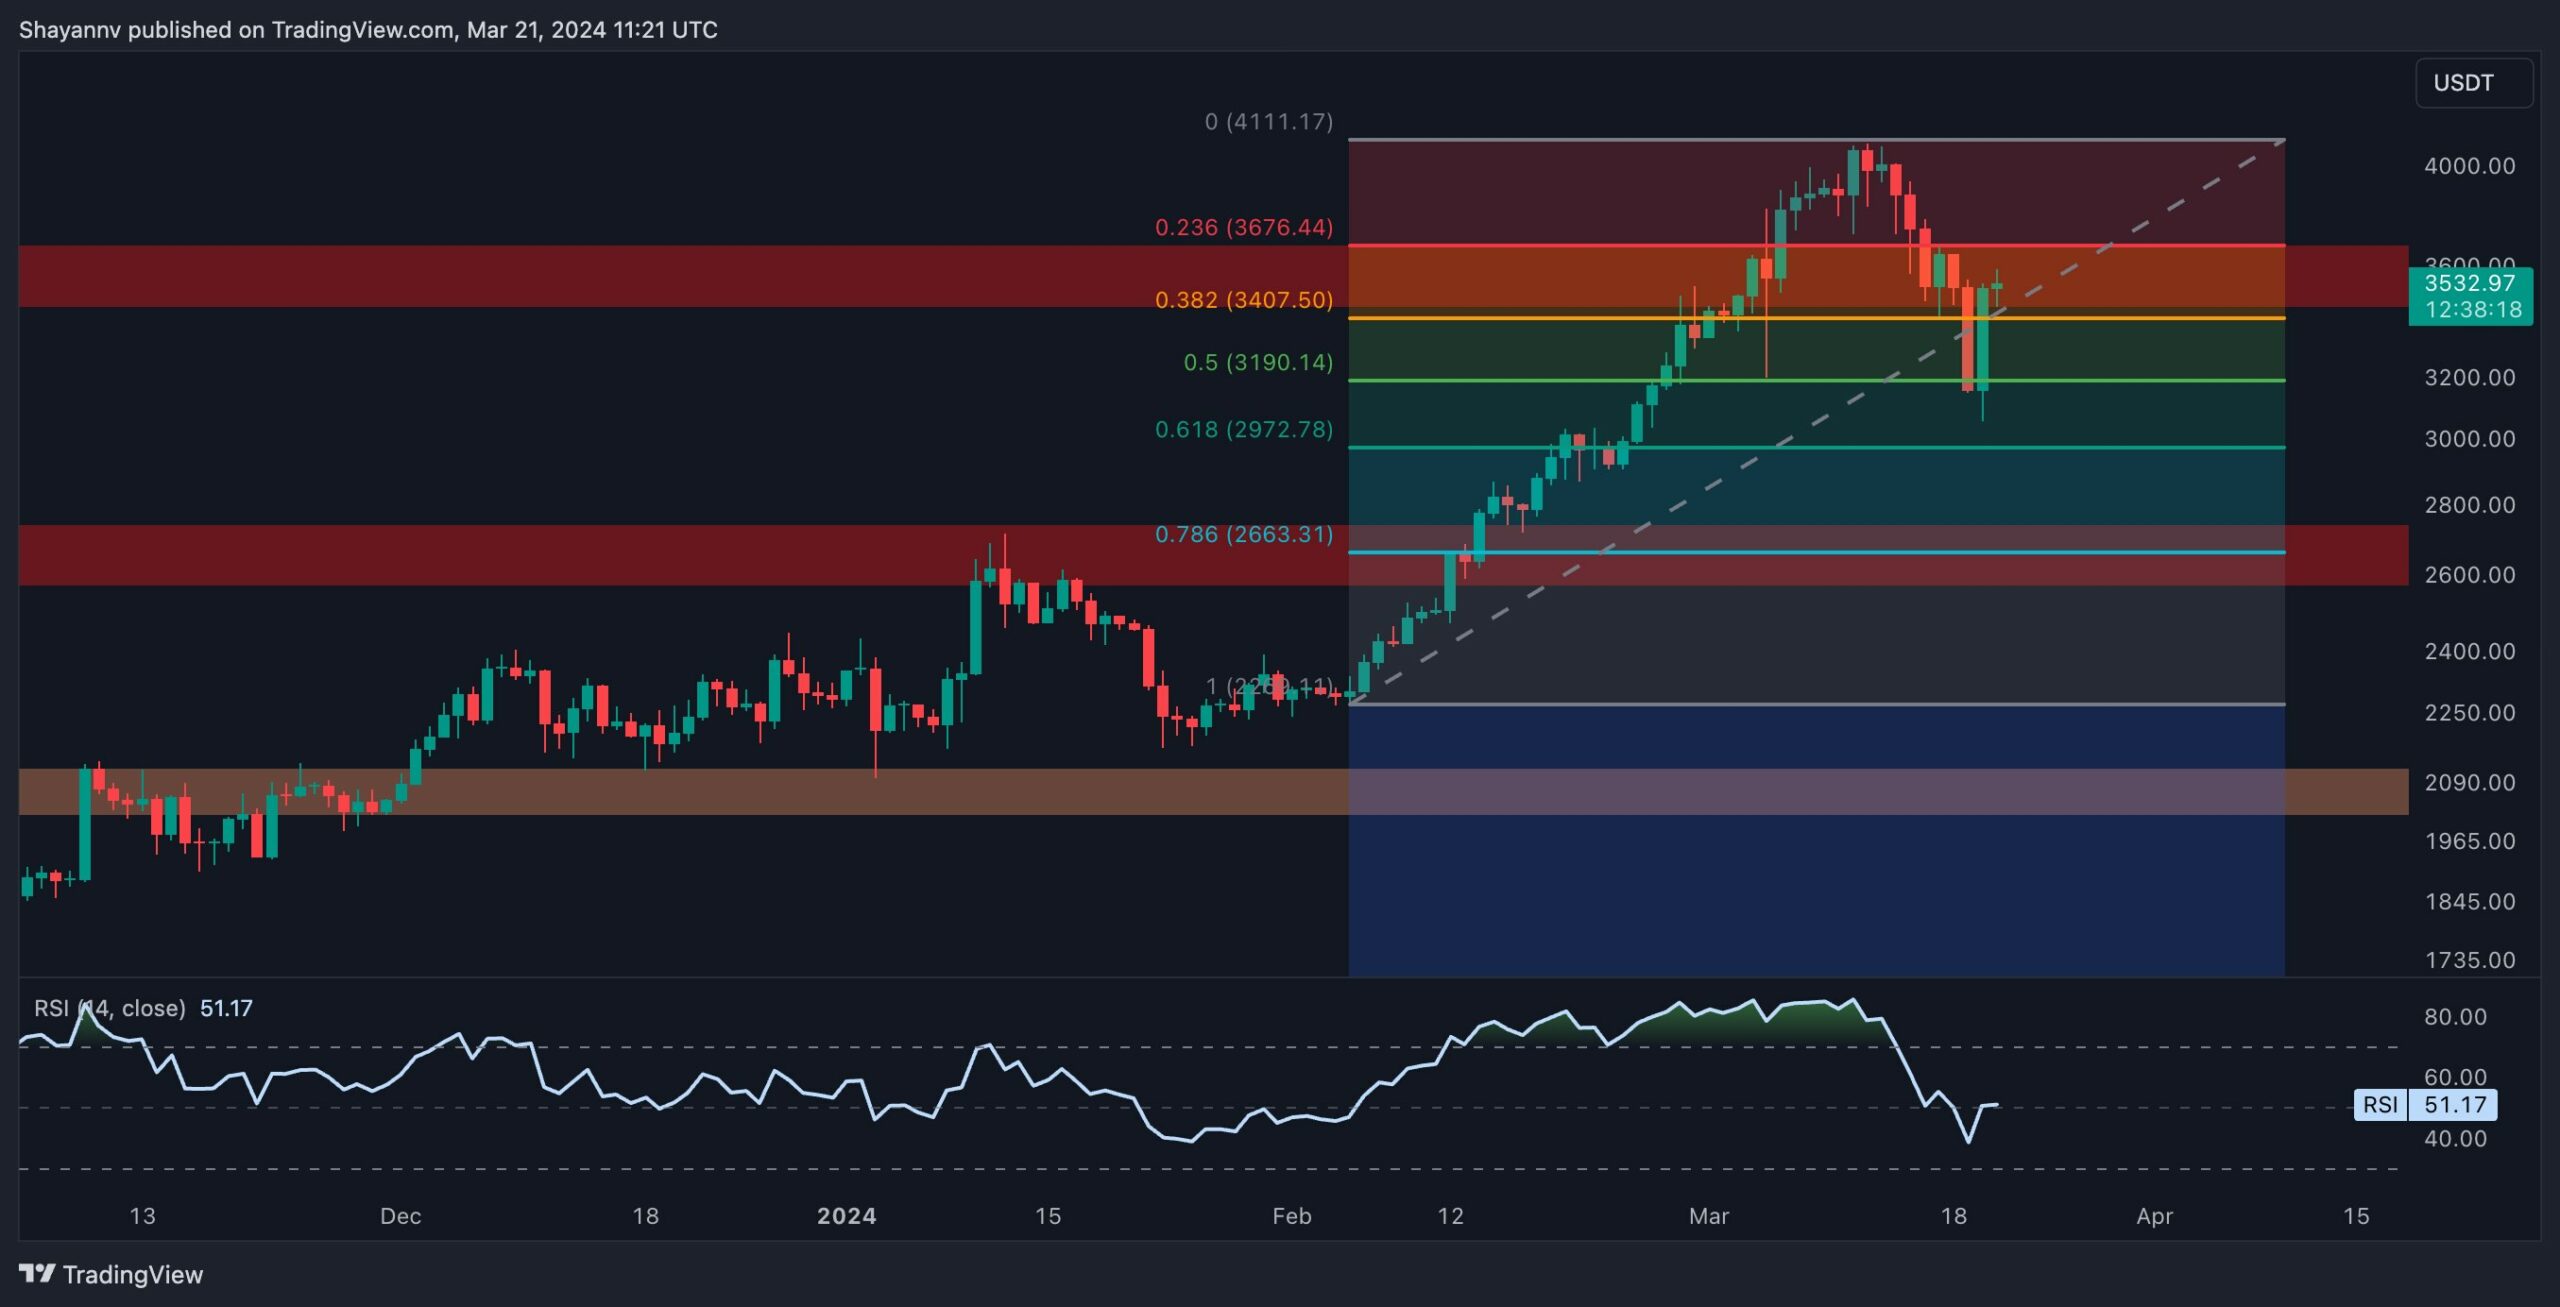
A comprehensive analysis of the daily chart reveals a prevailing bullish sentiment surrounding Ethereum, with the price briefly surpassing the critical and psychological resistance at $4K.
However, upon reaching this crucial level, the price encountered intensified selling pressure, resulting in a significant retracement towards the substantial support zone, delineated by the price range between the 0.5 ($3,190) and 0.618 ($2,972) Fibonacci retracement levels.
As previously noted, this price range attracts significant demand, leading to heightened buying pressure. Consequently, the price found substantial support in this crucial region, triggering a notable rebound. Nonetheless, Ethereum appears to be confined within a pivotal price range, bounded by the $4K resistance region and the critical support zone of $3K. A breakout from this key range will likely dictate Ethereum’s broader prospects.
The 4-Hour Chart
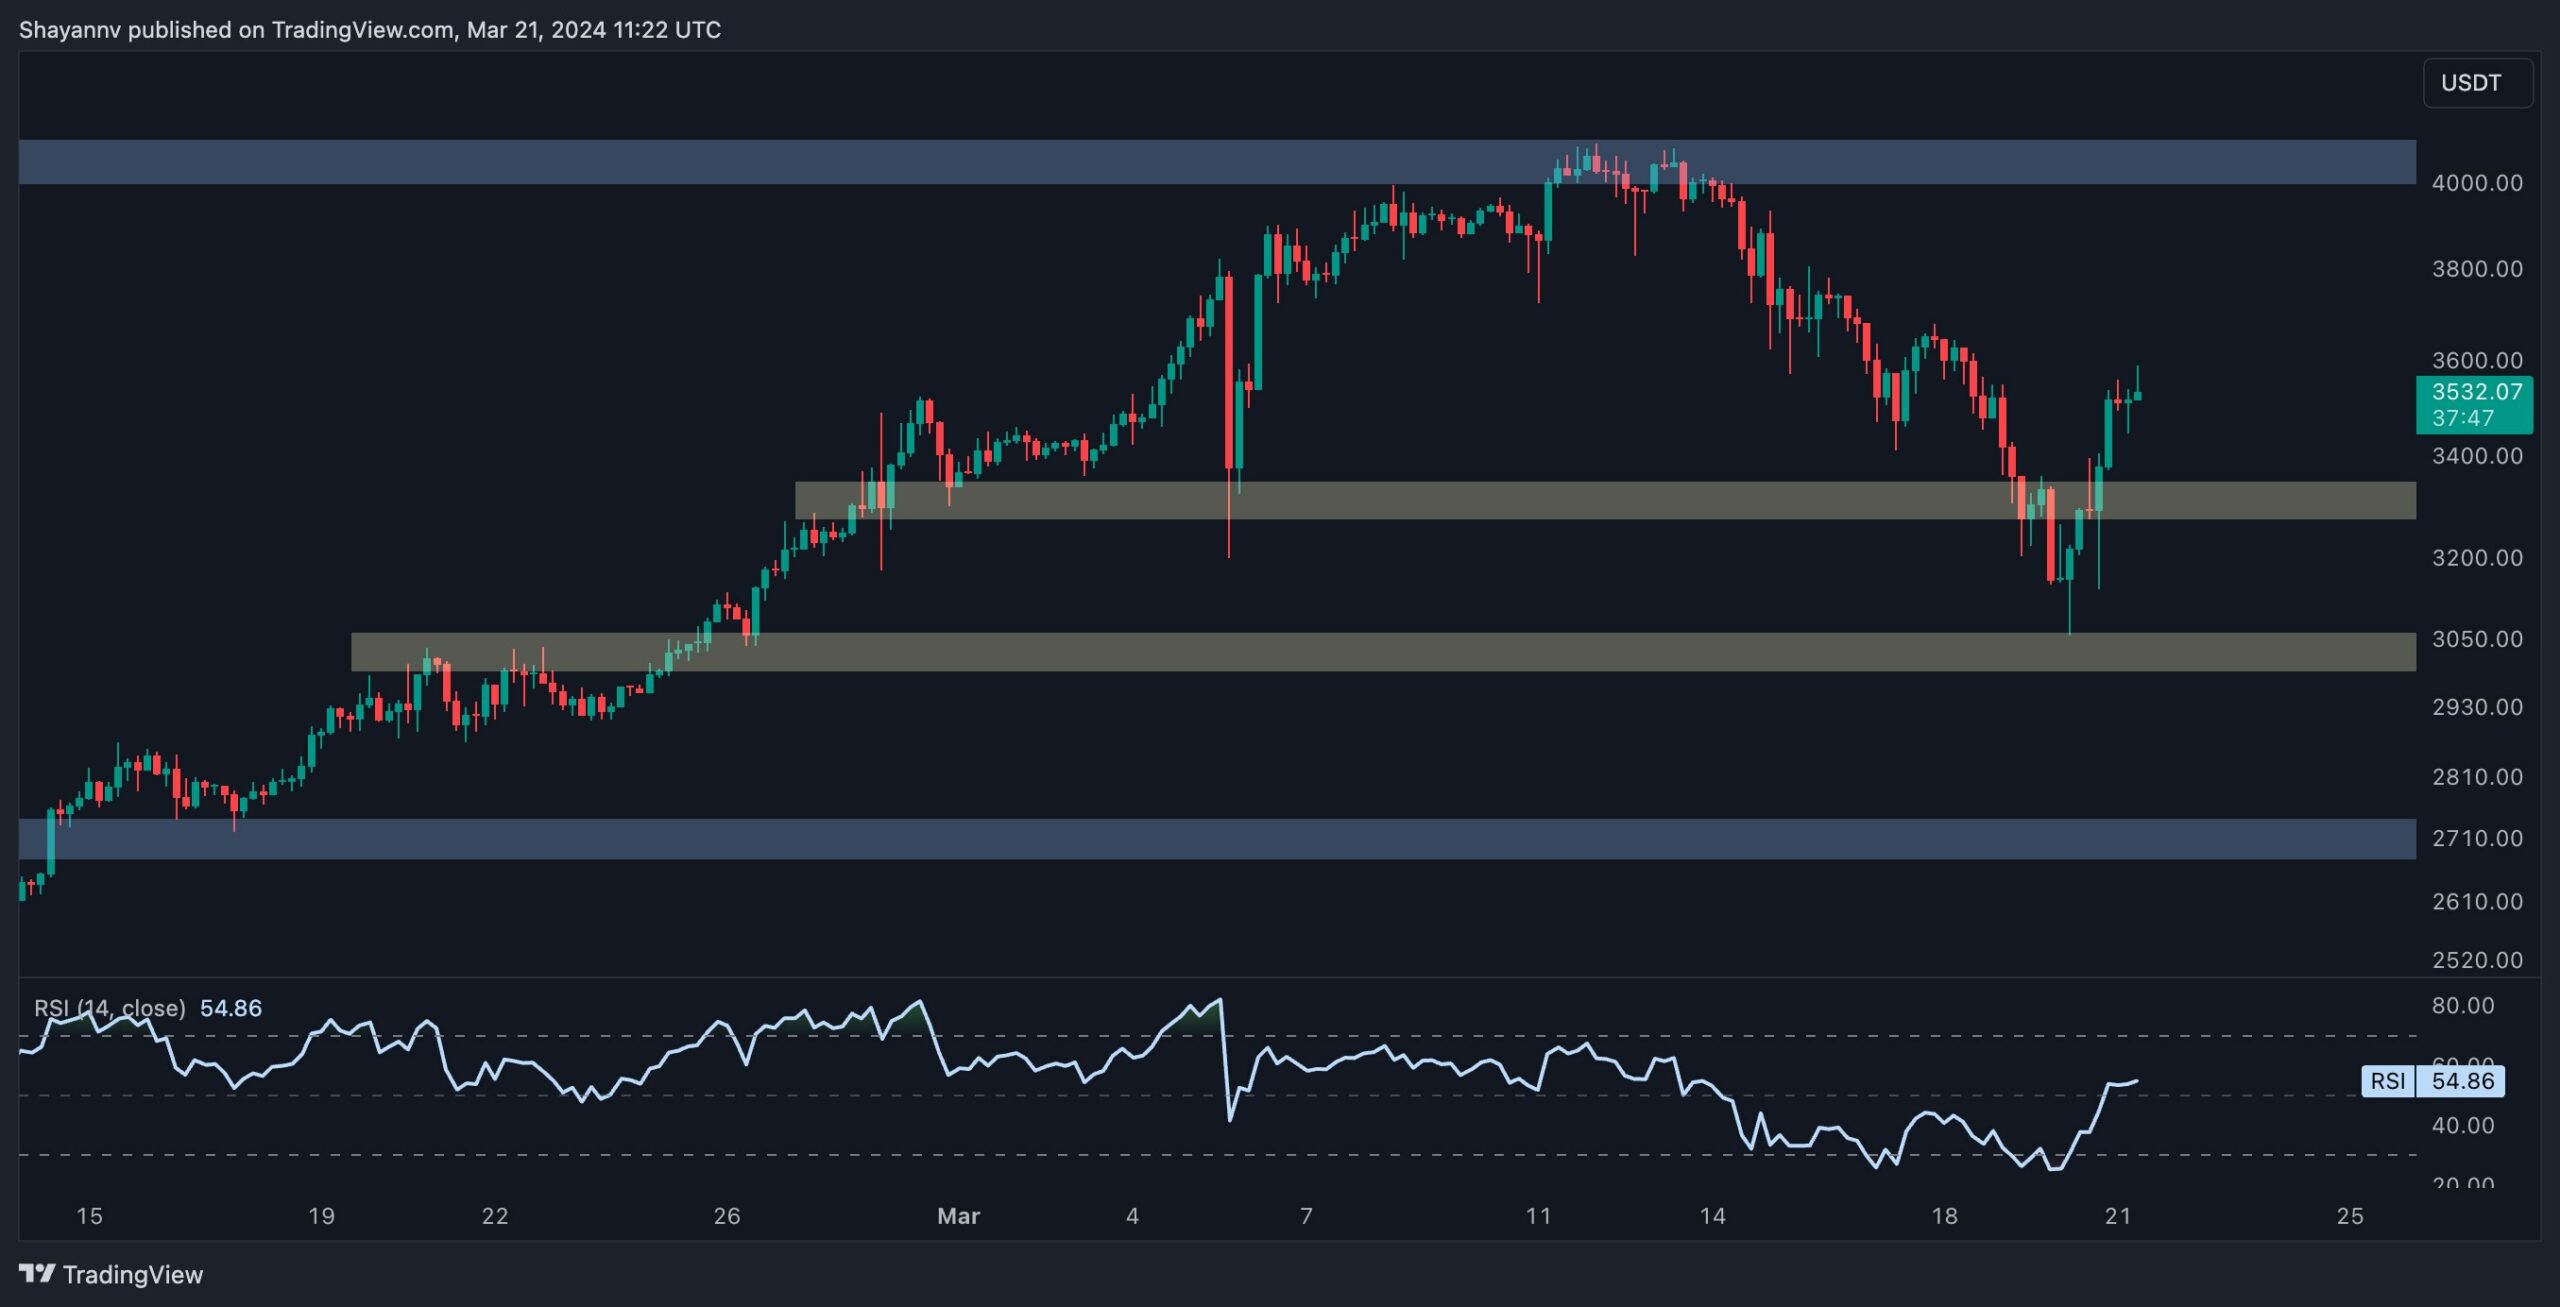
Further analysis of the 4-hour chart confirms the presence of sellers near the crucial resistance region of $4K, stalling Ethereum’s remarkable uptrend and prompting a significant reversal. Consequently, following a slight breach of the $4K threshold, the price encountered heightened selling pressure, leading to a sharp decline and a notable long-squeeze event, resulting in the liquidation of numerous long positions in the perpetual market.
Nevertheless, Ethereum’s downtrend was halted upon approaching the crucial and psychological support region at $3K, initiating a sharp bullish reversal. Currently, the price faces two significant milestones:
The critical resistance region is around $4K.
The significant support region is around $3.3K.
However, it’s essential to acknowledge that Ethereum is expected to enter a short-term consolidation stage within this key range and ultimately find support in the medium term, continuing its overall upward trajectory.
Sentiment Analysis
By Shayan
Ethereum’s price has experienced a rapid surge in recent weeks, briefly breaching the significant price mark of $4K. This surge has attracted a plethora of speculators to the market, resulting in increased buying pressure and bolstering confidence among investors.
Although Ethereum has yet to reach a new all-time high, market participants maintain high expectations for further price rallies, as evidenced by future market sentiment.
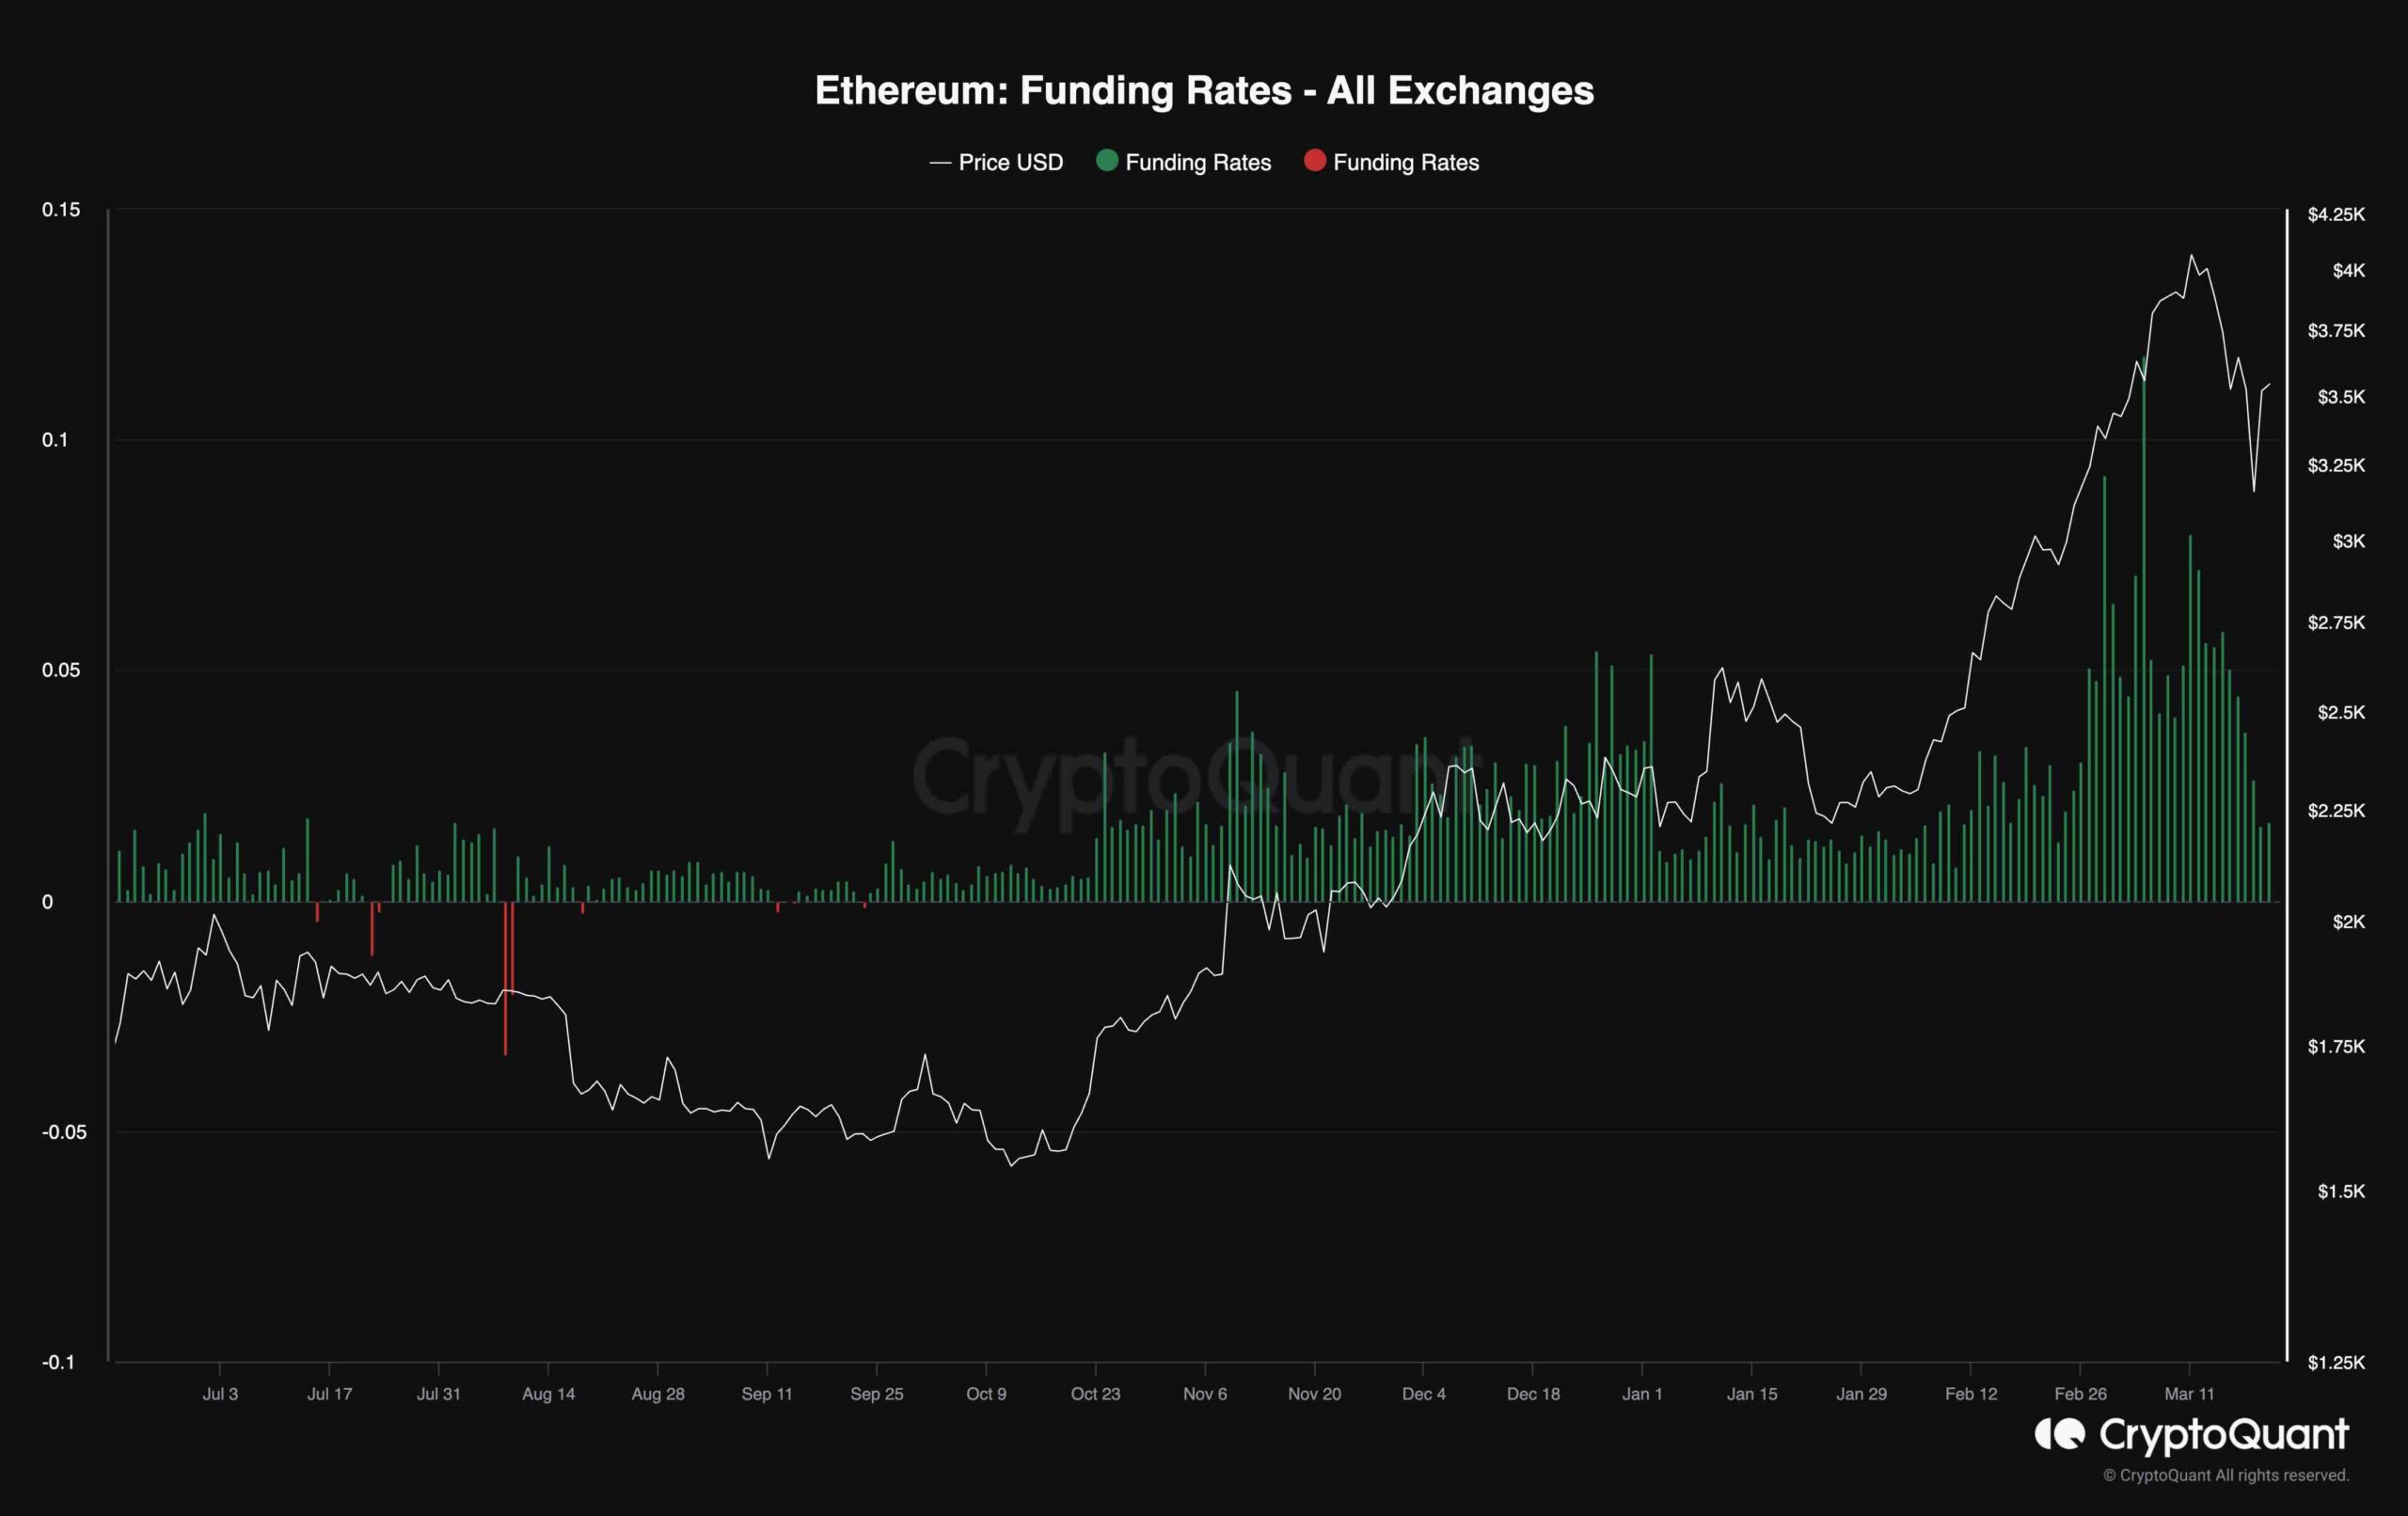
The chart illustrates Ethereum funding rates, which offer insights into whether buyers or sellers are executing orders more aggressively on aggregate. Positive values indicate bullish sentiment, while negative values suggest pessimism among market participants.
Observing the chart, it becomes apparent that following a significant surge in funding rate values recently, there has been a notable decline concurrent with the price undergoing a corrective retracement. This trend indicates that numerous long positions have been liquidated, leading to a cooling-down phase in the futures market. Consequently, the market appears poised for another impulsive move in the mid-term, with the potential for long positions to be reinstated in the perpetual market.
The post These Are the Two Critical Levels for ETH in the Short Term (Ethereum Price Analysis) appeared first on CryptoPotato.


