
Polkadot has been undergoing an extended bearish pullback, with its price reaching a notable support area that includes the 100-day moving average and the 0.618 Fibonacci retracement level. Despite this downturn, several indicators suggest a potential resurgence towards the crucial $10 mark.
Technical Analysis
By Shayan
Polkadot’s Price on the Daily Chart
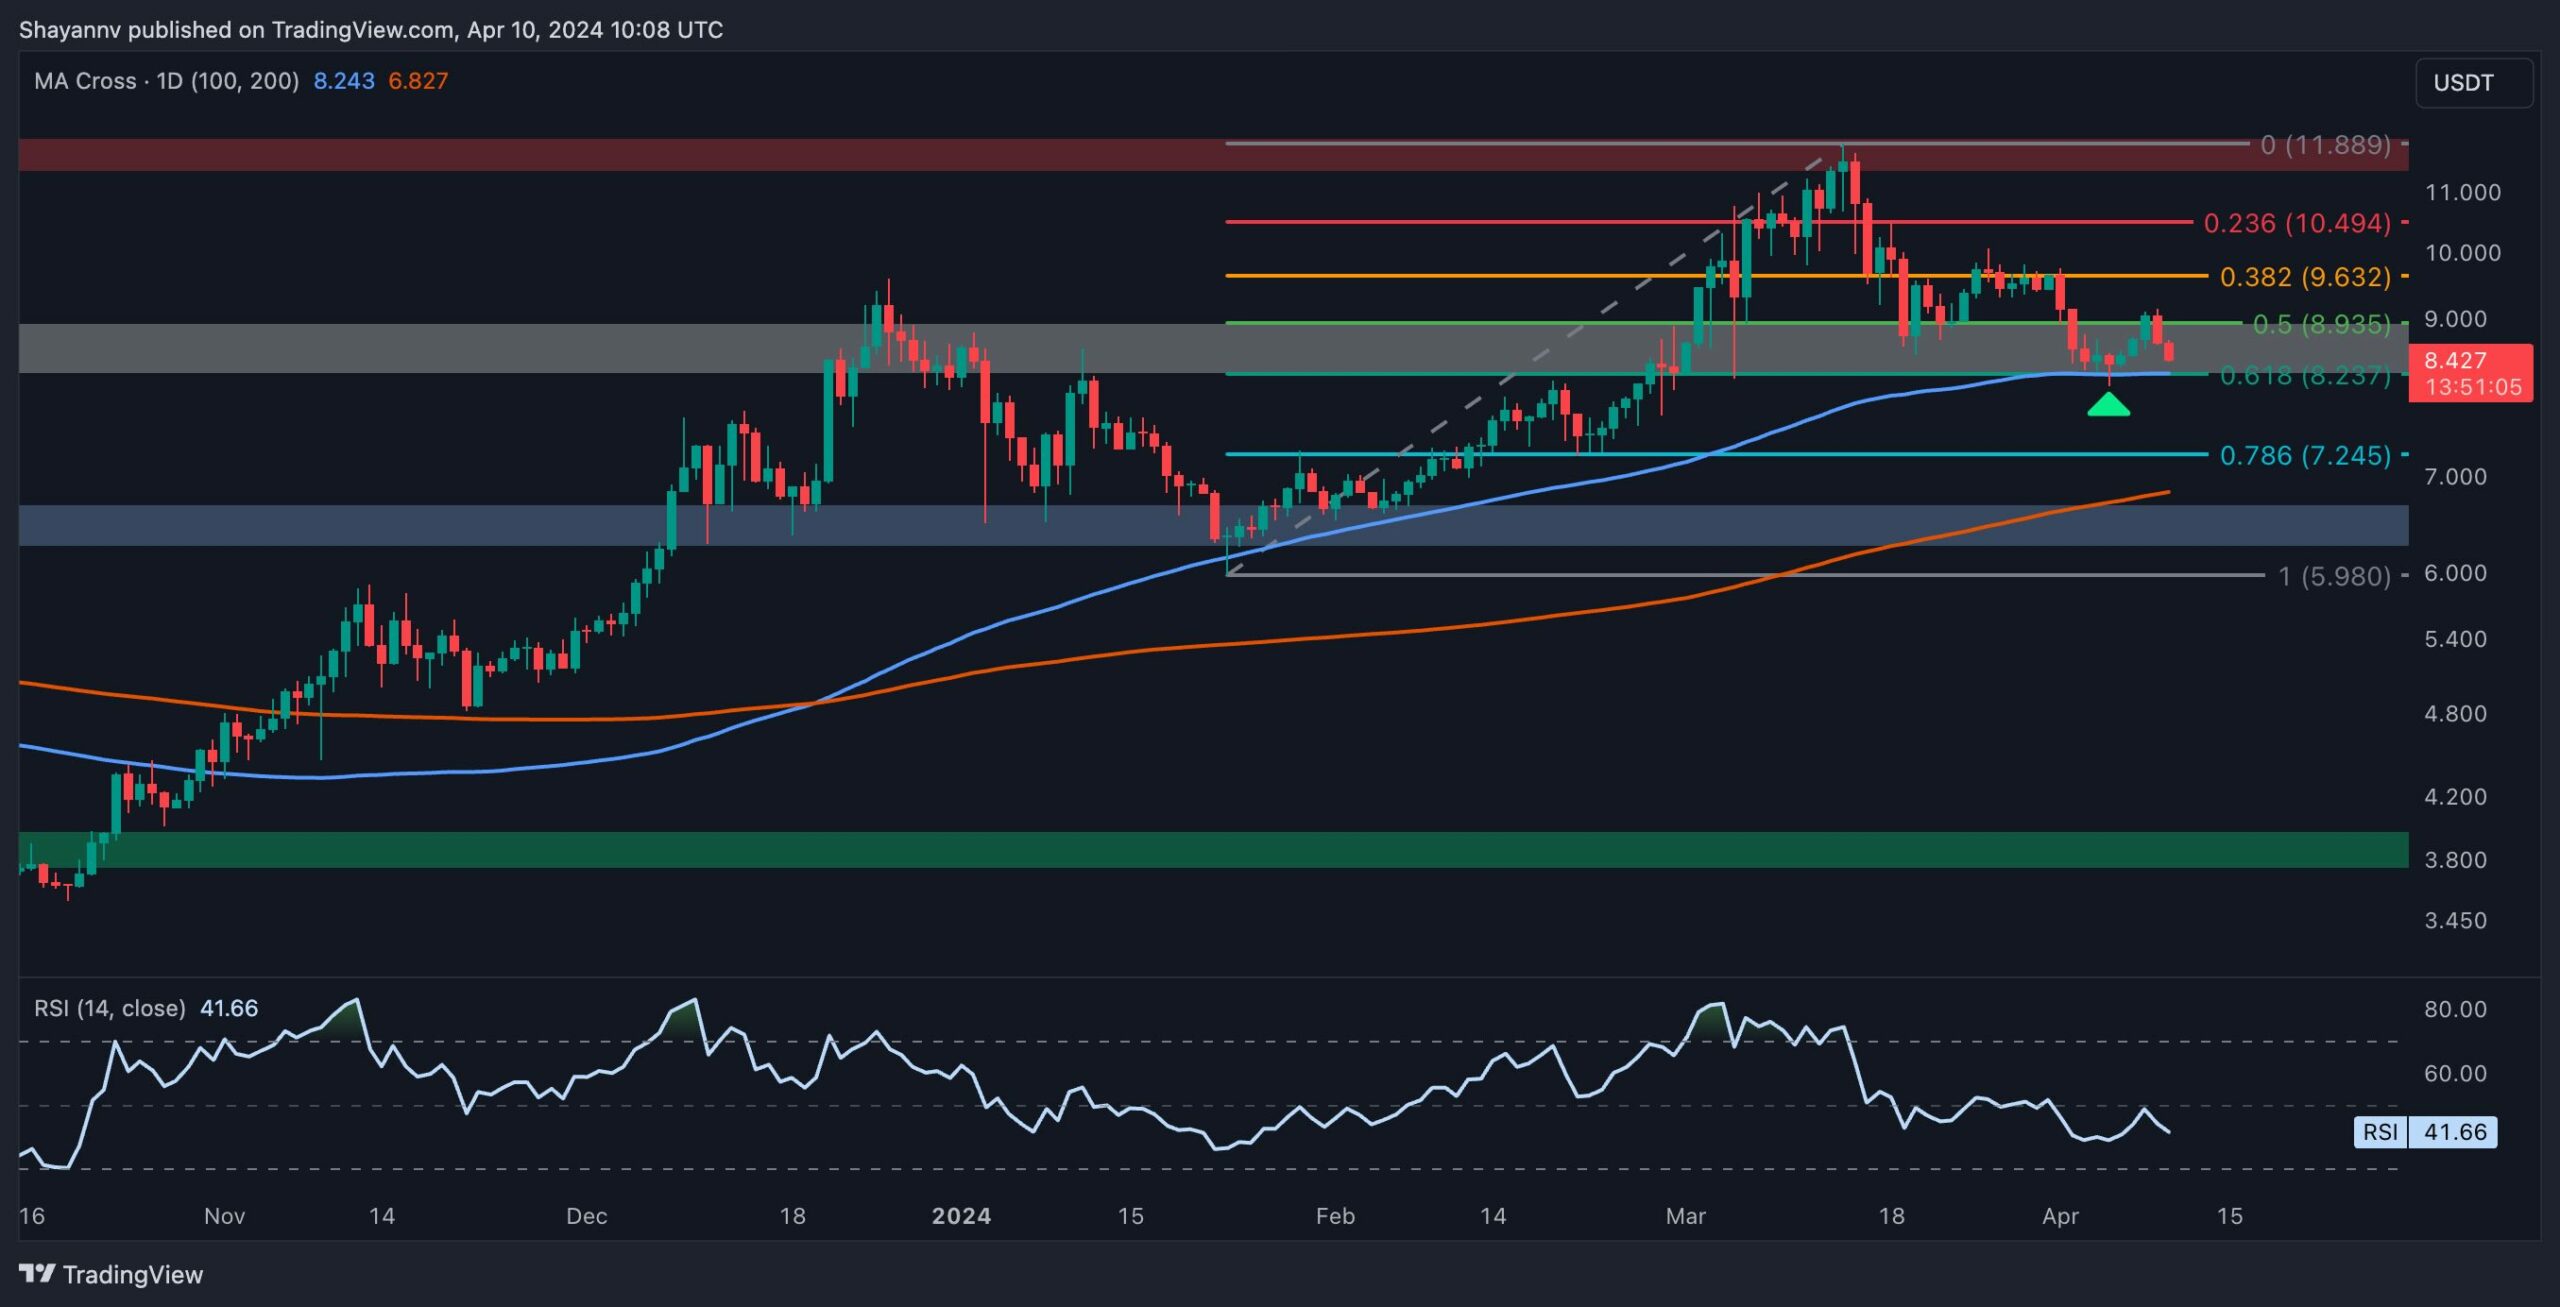
A detailed examination of the daily chart illustrates DOT’s sustained bearish retracement following its impressive climb to the yearly high of $11.9.
However, upon encountering a significant support zone marked by the 100-day moving average and the critical 0.618 Fib level at $8.2, the downward momentum diminished, resulting in minor price fluctuations.
The convergence of these support levels highlights strong demand at this pivotal threshold, accompanied by a notable presence of sell-stop liquidity beneath it.
Consequently, the price seems likely to tap into this prevailing liquidity and initiate a fresh upward movement, targeting the pivotal $10 resistance region. It’s important to acknowledge that a sudden breakdown could trigger a cascade effect, potentially leading to further declines.
DOT’s Price on the 4-Hour Chart
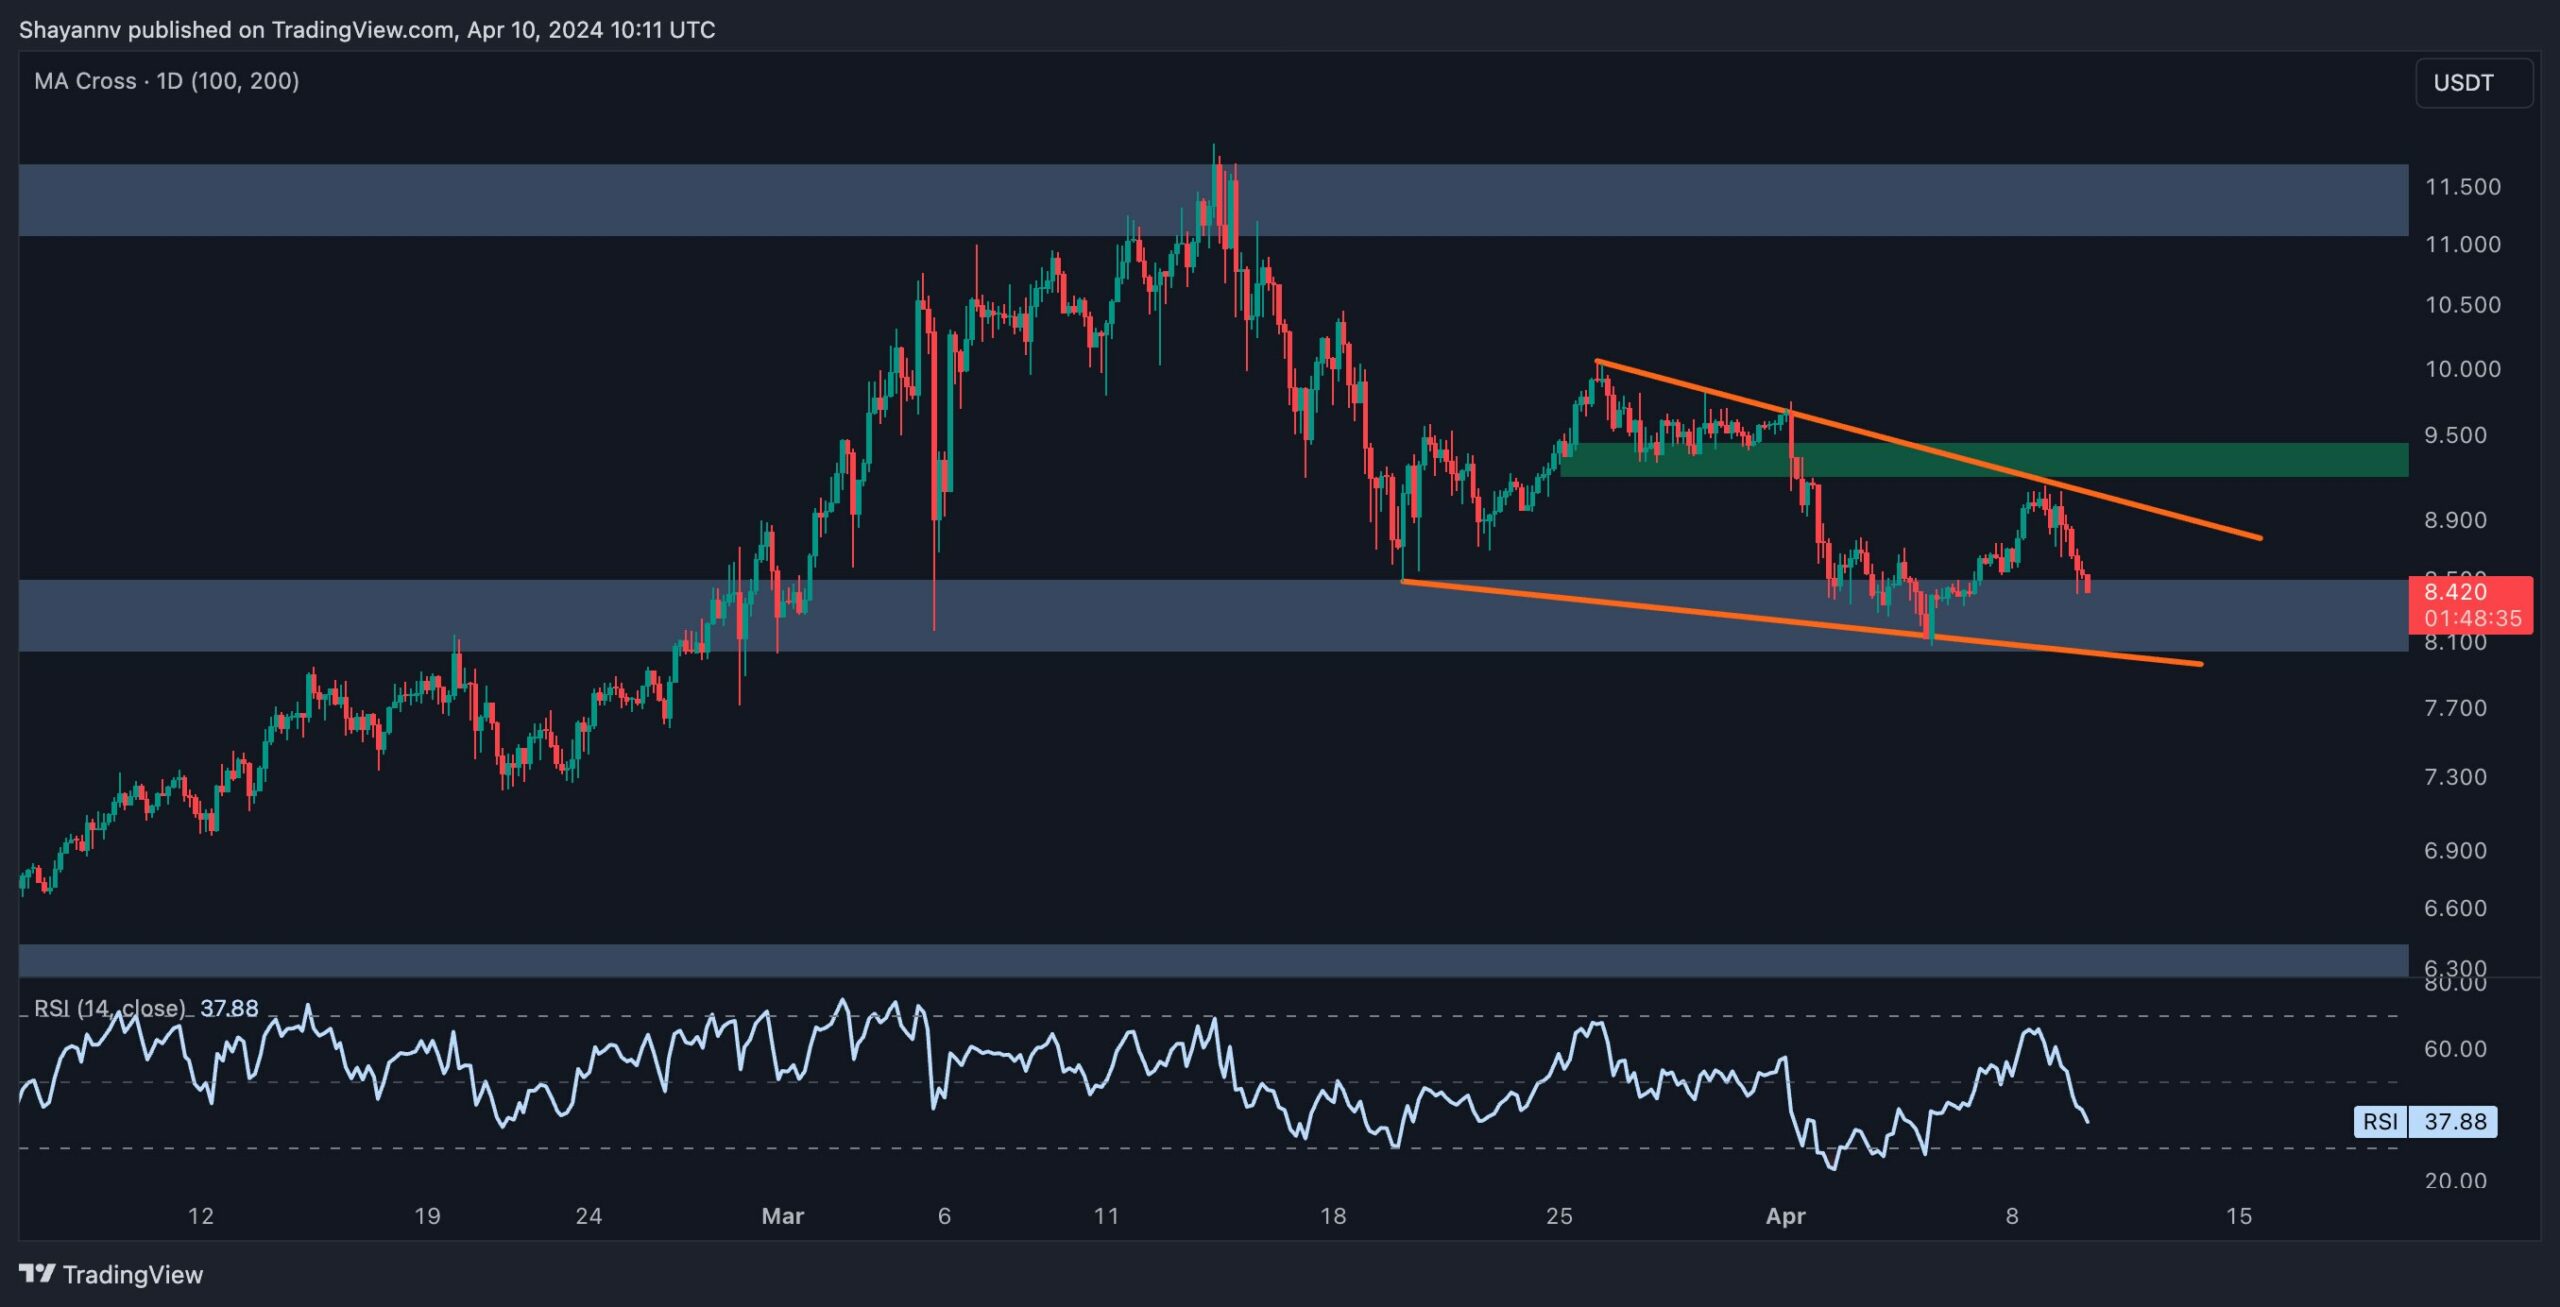
A comprehensive analysis of the 4-hour timeframe reveals Polkadot’s corrective retracements. The price recently found support near the crucial $8 level, prompting a modest rebound.
Notably, amidst these corrections, a falling wedge pattern has emerged, typically signaling a potential bullish reversal upon a breakout from its upper boundary.
However, DOT’s price faced rejection from the wedge’s upper boundary, resulting in a minor downturn. Consequently, it seems likely that the price will continue to fluctuate within this critical wedge pattern and around the significant $8 support zone until a breakout occurs. Nevertheless, the prevailing sentiment among market participants suggests an expectation of a renewed upward movement towards the $10 threshold in the medium term.
Sentiment Analysis
By Shayan
The liquidation of positions in the perpetual futures market stands as a pivotal catalyst for price fluctuations, demanding attention from traders as its influence on market dynamics cannot be overstated. Just as understanding high liquidity in the order book offers an advantage, gauging the liquidation levels of traders provides valuable insights.
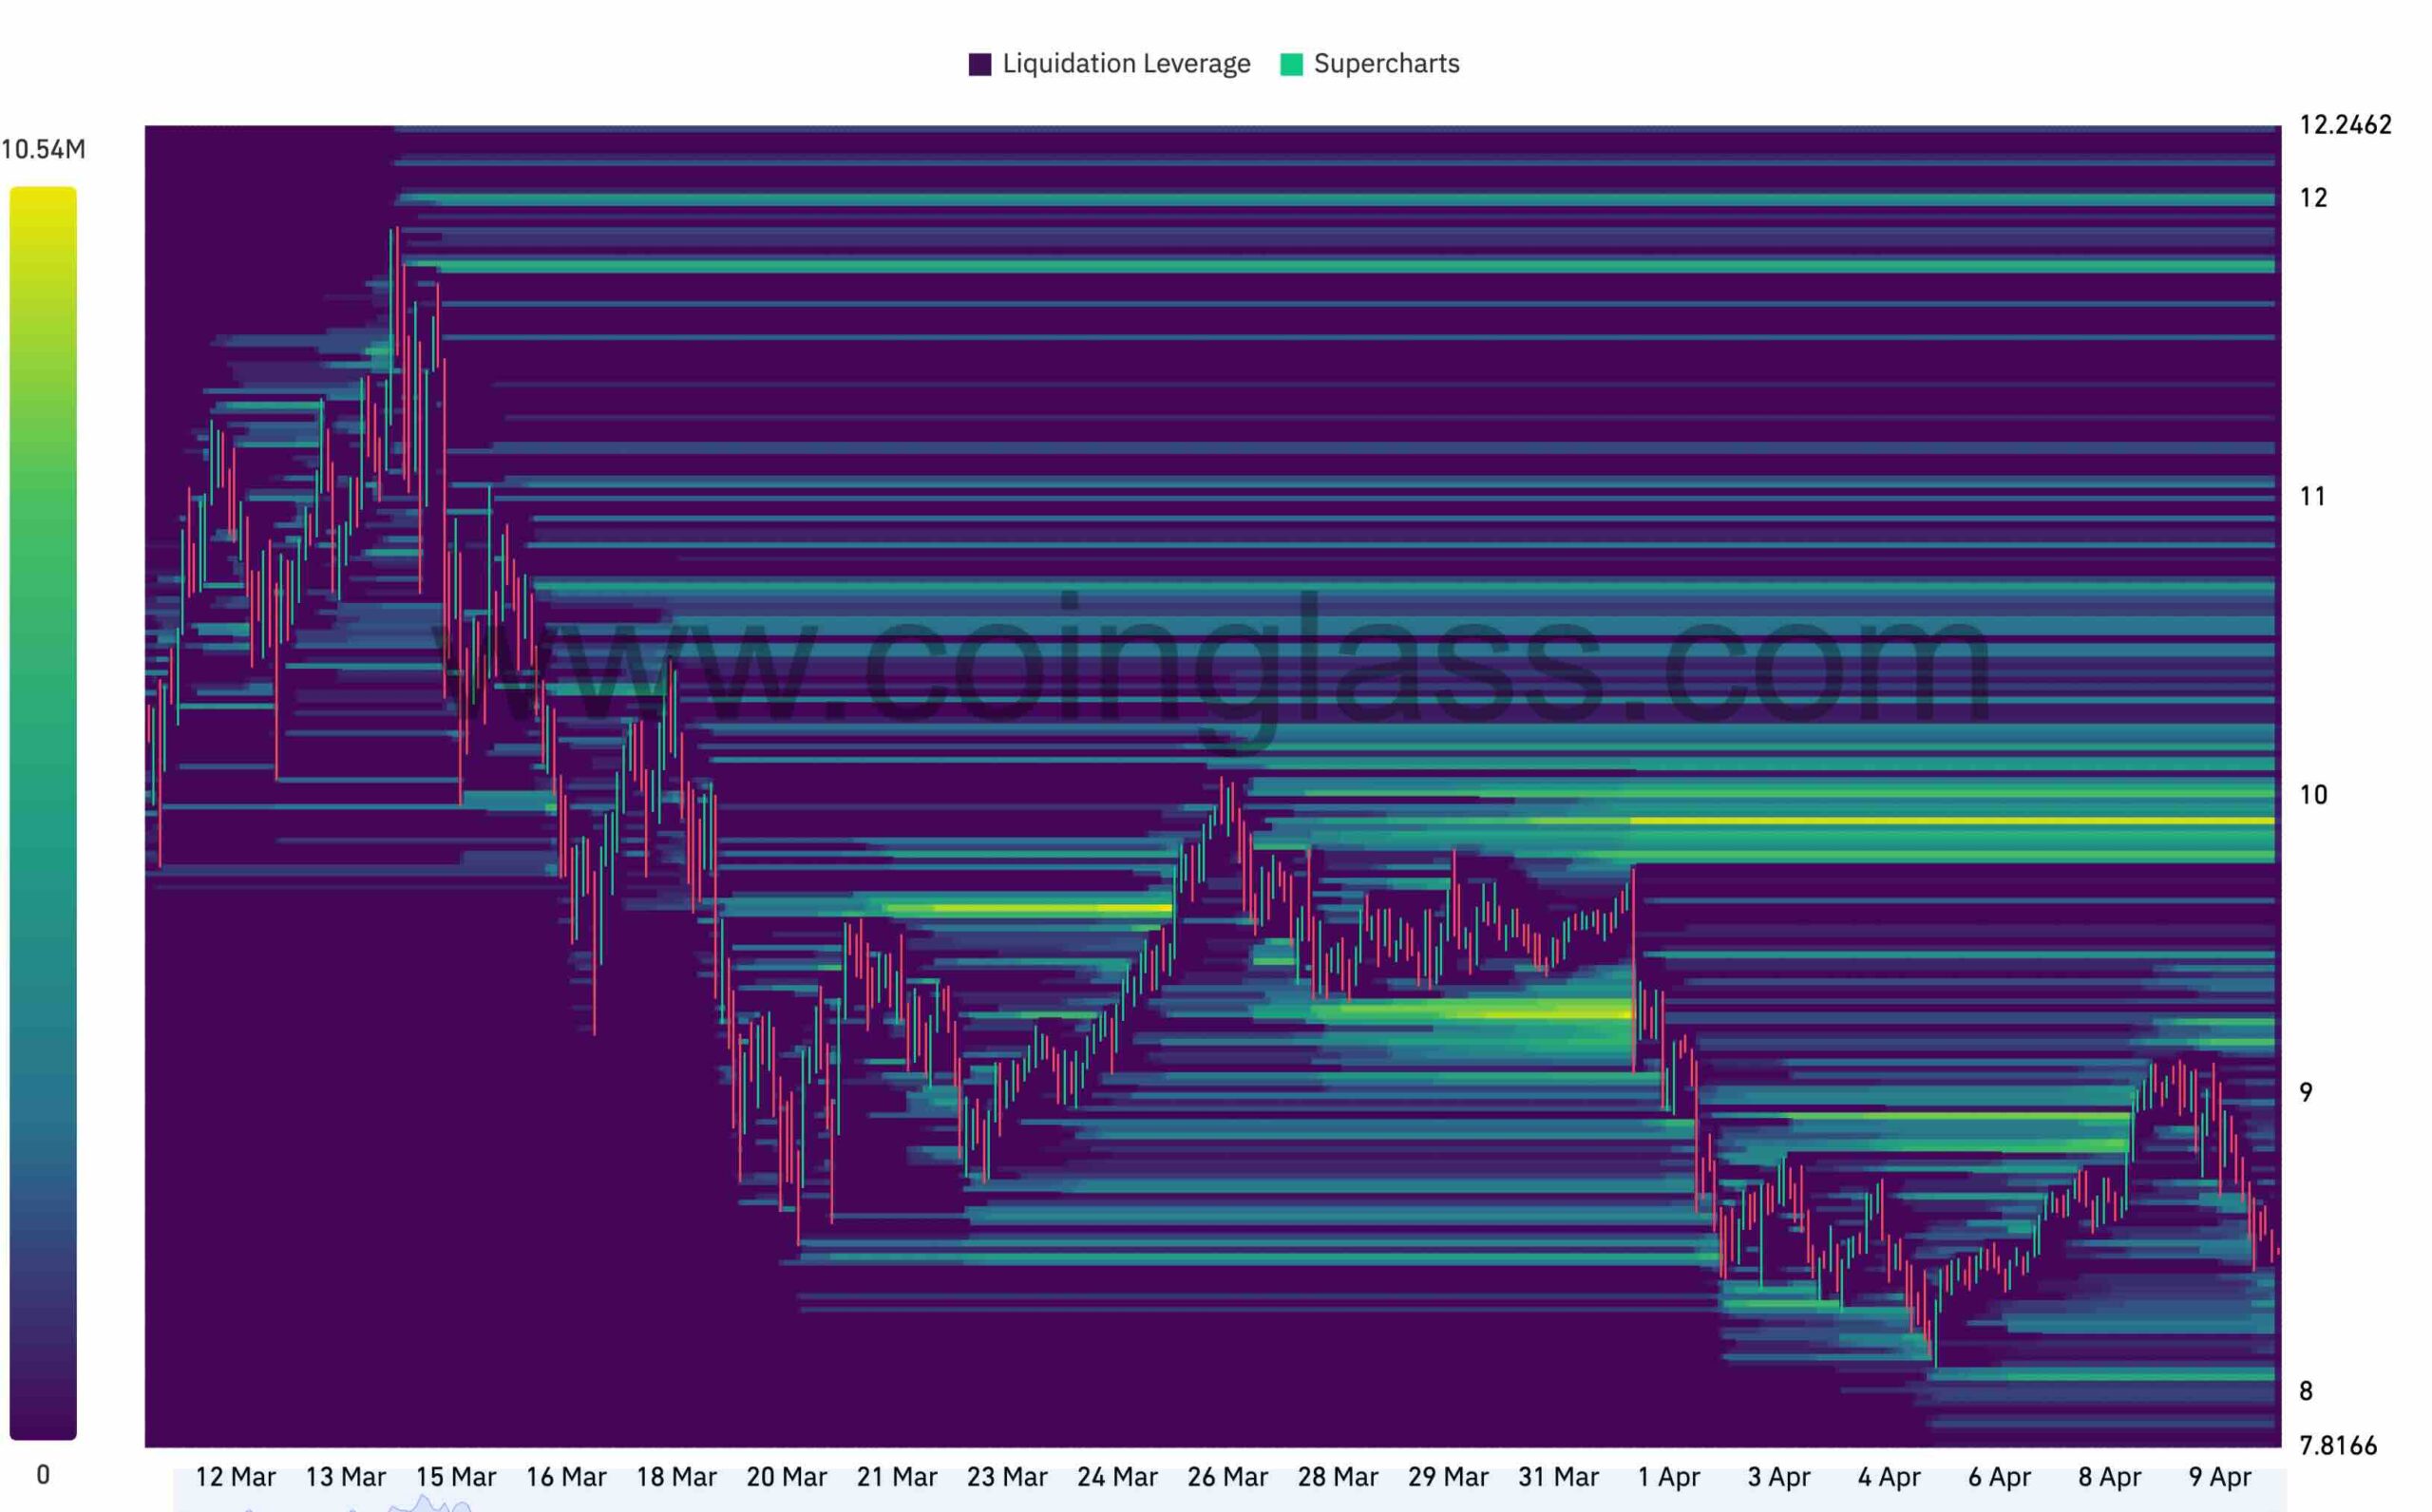
A liquidation heatmap from Coinglass is presented below for the DOT: USD pair, offering projections on significant liquidation zones. Ranging from purple to yellow, with yellow indicating heightened levels of anticipated liquidations, this heatmap aids traders in identifying areas of notable liquidity.
Upon analysis, it becomes evident that a substantial concentration of liquidity resides near the critical resistance zone at $10. This clustering of liquidation levels around the $10 price range suggests a probable movement towards that threshold in the medium term.
However, it’s essential to acknowledge the potential for a bearish scenario involving a sustained downtrend towards lower levels, which cannot be discounted.
The post Two Critical Factors to Consider for DOT as Bulls Eye $10: Polkadot Price Analysis appeared first on CryptoPotato.


