
The browser console: a developer’s haven for debugging, a battleground for taming errors, and sometimes, a surprising source of amusement. But lurking beneath the familiar console.log lies a treasure trove of methods waiting to be unleashed. Let’s embark on a detailed journey through the functionalities of the console object, transforming it from a simple message box to a full-fledged developer toolkit.
Unveiling the Console Menagerie:
First things first, we need to meet the key players – the console methods. These are built-in functions within the browser’s console object, allowing us to interact with it in various ways. Here’s a breakdown of some of the most commonly used ones, along with examples and explanations:
The Loggers:
console.log(): Your trusty companion for printing any data type (strings, numbers, objects, arrays) to the console. Let’s say you want to greet the world and verify a variable’s value:
console.log(“Hello, world!“); // Outputs: Hello, world!
const age = 130;
console.log(“My age is:“, age); // Outputs: My age is: 130
console.info(), console.warn(), and console.error(): These methods provide pre-defined styles for your messages, making them visually distinct in the console.
Use console.info() for informational messages:
console.info(“The user has successfully logged in.“); // Outputs: The user has successfully logged in. (May be blue depending on your browser)
Employ console.warn() for warnings:
const userName = “”;
if (!userName) {
console.warn(“Username cannot be empty.“); // Outputs: (Yellow colored warning message)
}
Reserve console.error() for critical errors that halt program execution:
try {
// Code that might throw an error
} catch (error) {
console.error(“An error occurred:“, error); // Outputs: (Red colored error message with details)
}
Beyond Simple Text:
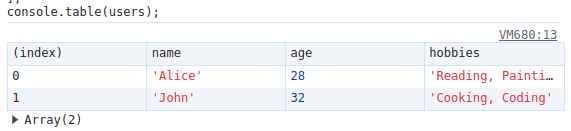
console.table(): Tired of squinting at complex objects and arrays in the console? console.table() transforms these data structures into a clear, readable table format. Let’s examine a user object:
{
name: “Alice“,
age: 28,
hobbies: “Reading, Painting“,
},
{
name: “John“,
age: 32,
hobbies: “Cooking, Coding“,
},
];
console.table(users);
// Outputs: (User table)
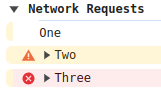
console.group() and console.groupEnd(): When dealing with a large amount of logs, organization is key. These methods help you create collapsible sections in the console, grouping related messages together. Imagine debugging a network request:
console.log(“One“);
console.warn(“Two“);
console.error(“Three“);
console.groupEnd(); // Collapses all messages above into a section labeled “Network Requests”
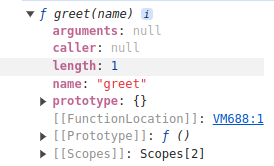
console.dir() and console.dirxml(): Sometimes, you need a more detailed breakdown of a variable or DOM element.
console.dir(variable) provides a detailed inspection of the variable’s properties and methods:
console.log(“Hello,“, name);
}
console.dir(greet); // Shows the function definition, arguments, etc.
console.dirxml(DOMElement) delves into the structure of a DOM element, displaying its attributes, child nodes, and more:
console.dirxml(heading); // Shows the HTML structure of the h1 element
Advanced Techniques: Unleashing the Power of the Console
The console offers more than just logging messages. Let’s delve into some advanced features that can elevate your debugging experience:
Performance Profiling:
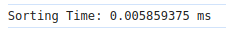
console.time() and console.timeEnd(): Ever wondered how long a particular code block takes to execute?
These methods help you measure the execution time of code blocks. Imagine you want to benchmark a sorting algorithm’s performance:
const numbers = [10, 2, 5, 8, 1];
console.time(“Sorting Time“);
numbers.sort(); // Sorts the numbers array
console.timeEnd(“Sorting Time“); // Outputs the time taken for sorting in milliseconds
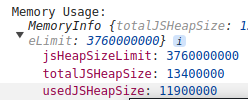
Memory Monitoring:
The console.memory property provides insights into JavaScript heap size usage. This can be helpful in identifying potential memory leaks in your application. Let’s get a snapshot of the current memory usage:
console.log(“Memory Usage:“, console.memory); // Outputs an object with details like total heap size and used heap size
Debugging Delights:
console.assert(): This method is like a guardrail for your code. It checks a condition and throws an error if the condition is false, helping you debug assumptions made in your code. Imagine validating user input:
const age = prompt(“Enter your age:“);
console.assert(age >= 18, “User must be an adult to proceed“); // Throws an error if age is less than 18
console.trace(): Ever felt lost in a maze of error messages? console.trace() comes to the rescue. It prints a stack trace along with error messages, pinpointing the exact location in your code where the error originated. This can be immensely helpful for debugging complex issues:
function calculateArea(width, height) {
if (width <= 0 || height <= 0) {
throw new Error(“Width and height must be positive values“);
}
return width * height;
}
try {
const area = calculateArea(–2, 5); // This will throw an error
} catch (error) {
console.error(“Error:“, error);
console.trace(); // Prints the stack trace along with the error message
}
Remember: Not all console methods are available in every environment (browser vs. Node.js). It’s always a good practice to check the browser console’s documentation for complete functionality.
Beyond the Basics: Making Debugging Fun!
The console is a powerful tool, but it can also be a playground for creativity. Here are some ideas to spice up your debugging sessions and make them a little more enjoyable:
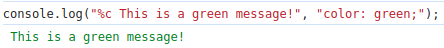
Colorful Logs: Use string interpolation and CSS styles within console.log statements to create colorful messages that stand out in the console.
Example:
console.log(“%c This is a green message!“, “color: green;“); // Outputs a green colored message
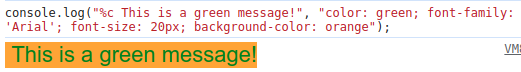
Or you can get really fancy:
Interactive Debugging: Prompt the user for input within the console using functions like prompt(). This can be useful for gathering additional information during debugging:
const userInput = prompt(“What variable do you want to inspect?“);
console.dir(window[userInput]); // Accesses the variable from the global window object
Leave Funny Easter Eggs: For complex projects, hide humorous messages within conditional console.log statements for fellow developers to discover.
Example:
if (process.env.NODE_ENV === “production“) {
console.log(“Shh… you shouldn’t be looking at the console in production!“);
} else {
console.log(“Welcome to the debugging console! “);
}
Remember: While these can be fun, avoid cluttering the console with unnecessary messages in production environments.
The console is more than just a window for console.log statements. It’s a versatile tool for debugging, performance analysis, and even a bit of developer entertainment. So, the next time you open your browser’s console, take a moment to explore its full potential and make your debugging sessions a little more delightful!
The majority of this article is AI generated.
Article by BestCodes (well, kinda)

