
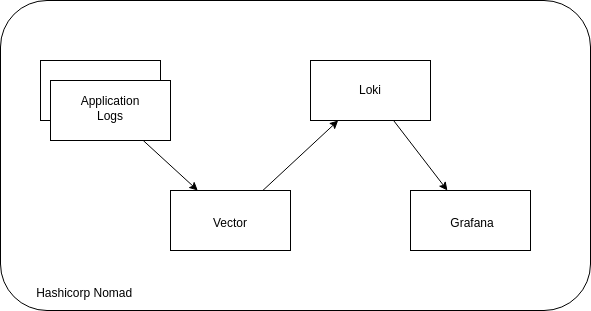
Monitoring application logs is a crucial aspect of the software development and deployment lifecycle. In this post, we’ll delve into the process of observing logs generated by Docker container applications operating within HashiCorp Nomad. With the aid of Grafana, Vector, and Loki, we’ll explore effective strategies for log analysis and visualization, enhancing visibility and troubleshooting capabilities within your Nomad environment.
Steps:
Install Nomad in Linux
Install Docker
Run Nomad in both server and client mode
Run Loki in Nomad
Deploy Logging app
Deploy Vector in Nomad
Deploy Grafana
Observe logs in Grafana using Loki Datasource
Application structure
Install Nomad locally (Linux)
Nomad, much like Kubernetes, serves as a powerful container orchestration tool, facilitating seamless application deployment and management. In this guide, we’ll walk through the installation process on a Linux machine, specifically Ubuntu 22.04 LTS. Let’s dive in:
Install required packages
Add the HashiCorp GPG key
Add official Hasicorp Linux Repository
Update and Install
This command will install the latest Nomad binary. The installation can be confirmed by checking the version of nomad by running
Install Docker
To deploy containers, docker is essential and can be installed by the following steps. Nomad will detect the docker in a system using docker driver and use it to deploy containers.
Set up Docker’s apt repository
sudo apt-get update
sudo apt-get install ca-certificates curl
sudo install -m 0755 -d /etc/apt/keyrings
sudo curl -fsSL https://download.docker.com/linux/ubuntu/gpg -o /etc/apt/keyrings/docker.asc
sudo chmod a+r /etc/apt/keyrings/docker.asc
# Add the repository to Apt sources:
echo
“deb [arch=$(dpkg –print-architecture) signed-by=/etc/apt/keyrings/docker.asc] https://download.docker.com/linux/ubuntu
$(. /etc/os-release && echo “$VERSION_CODENAME“) stable” |
sudo tee /etc/apt/sources.list.d/docker.list > /dev/null
sudo apt-get update
Install Docker
Restart docker and update permission
$ sudo usermod -aG docker ubuntu
Run Nomad in both server and client mode
Nomad binary can run in both server and client mode. The server manages the state of the cluster and clients are used to deploy applications. In production, multiple Nomad servers and clients running in separate machines are interconnected to form a cluster. Here, we will use a single machine to run both server and client.
Nomad require a config file to run the application in server and client mode. The config file is also required to add more capabilities to nomad such as adding docker driver, setting telemetry, autopilot and so on.
Here is the nomad configuration file which can be used to run nomad. It also contains the information required to run docker containers. Create a file nomad.hcl and copy the below content to the file.
data_dir = “/opt/nomad/data”
bind_addr = “0.0.0.0”
log_level = “INFO”
server {
enabled = true
bootstrap_expect = 1
search {
fuzzy_enabled = true
limit_query = 200
limit_results = 1000
min_term_length = 5
}
}
# Enable the client
client {
enabled = true
options {
“driver.raw_exec.enable” = “1”
“docker.privileged.enabled” = “true”
}
server_join {
retry_join = [ “127.0.0.1” ]
}
}
plugin “docker” {
config {
endpoint = “unix:///var/run/docker.sock”
extra_labels = [“job_name”, “job_id”, “task_group_name”, “task_name”, “namespace”, “node_name”, “node_id”]
volumes {
enabled = true
selinuxlabel = “z”
}
allow_privileged = true
}
}
telemetry {
collection_interval = “15s”
disable_hostname = true
prometheus_metrics = true
publish_allocation_metrics = true
publish_node_metrics = true
}
Run the following command in the terminal where the above file is located to start Nomad.
This will start the application.
==> Starting Nomad agent…
==> Nomad agent configuration:
Advertise Addrs: HTTP: 192.168.1.32:4646; RPC: 192.168.1.32:4647; Serf: 192.168.1.32:4648
Bind Addrs: HTTP: [0.0.0.0:4646]; RPC: 0.0.0.0:4647; Serf: 0.0.0.0:4648
Client: true
Log Level: INFO
Node Id: 2921dae9-99dc-a65d-1a1f-25d9822c1500
Region: global (DC: dc1)
Server: true
Version: 1.7.7
==> Nomad agent started! Log data will stream in below:
The Nomad UI will be available in the advertise address. Here it is, 192.168.1.32:4646, This will be based on the network interface you are connected and the value will be different for different machines. Going to this IP and port in web browser will open nomad UI as shown below.
You have installed both nomad and docker in the system and ready to deploy the observability applications!
Run Loki in Nomad
Loki is a scalable log aggregation system and is designed to be very cost effective and easy to operate. It does not index the contents of the logs, but rather a set of labels for each log stream. It is configured such that the logs are persisted to the file system. It can also be configured to store the data in various datastores like AWS S3, Minio and so on.
The nomad job file used to run loki is given below.
datacenters = [“dc1”]
type = “service”
group “loki” {
count = 1
network {
mode = “host”
port “loki” {
to = 3100
static = 3100
}
}
service {
name = “loki”
port = “loki”
provider = “nomad”
}
task “loki” {
driver = “docker”
user = “root”
config {
image = “grafana/loki:2.9.7”
args = [
“-config.file”,
“local/config.yml”,
]
volumes = [“/loki_data:/loki”]
ports = [“loki”]
}
template {
data=<<EOH
auth_enabled: false
server:
http_listen_port: 3100
ingester:
lifecycler:
address: 127.0.0.1
ring:
kvstore:
store: inmemory
replication_factor: 1
final_sleep: 0s
# Any chunk not receiving new logs in this time will be flushed
chunk_idle_period: 1h
# All chunks will be flushed when they hit this age, default is 1h
max_chunk_age: 1h
# Loki will attempt to build chunks up to 1.5MB, flushing if chunk_idle_period or max_chunk_age is reached first
chunk_target_size: 1048576
# Must be greater than index read cache TTL if using an index cache (Default index read cache TTL is 5m)
chunk_retain_period: 30s
max_transfer_retries: 0 # Chunk transfers disabled
wal:
enabled: true
dir: “/loki/wal”
schema_config:
configs:
– from: 2020-10-24
store: boltdb-shipper
object_store: filesystem
schema: v11
index:
prefix: index_
period: 24h
storage_config:
boltdb_shipper:
active_index_directory: /loki/boltdb-shipper-active
cache_location: /loki/boltdb-shipper-cache
cache_ttl: 24h # Can be increased for faster performance over longer query periods, uses more disk space
shared_store: filesystem
filesystem:
directory: /loki/chunks
compactor:
working_directory: /loki/boltdb-shipper-compactor
shared_store: filesystem
limits_config:
reject_old_samples: true
reject_old_samples_max_age: 168h
chunk_store_config:
max_look_back_period: 0s
table_manager:
retention_deletes_enabled: false
retention_period: 0s
EOH
destination = “local/config.yml”
change_mode = “restart”
}
resources {
cpu = 1000 #Mhz
memory = 1000 #MB
}
}
}
}
Copy the above job configuration and add it in the nomad UI.
Deploy Logging app
The logging app is a simple docker container which emits logs randomly. It send 4 log levels, INFO, ERROR, WARNING and DEBUG to stdout. The job file is give below.
datacenters = [“dc1”]
type = “service”
group “logger” {
count = 1
task “logger” {
driver = “docker”
config {
image = “chentex/random-logger:latest”
}
resources {
cpu = 100 # 100 MHz
memory = 100 # 100MB
}
}
}
}
Copy the above configuration and deploy another job from Nomad UI.
Deploy Vector in Nomad
Vector is log collecting agent which support many source and destination for log ingestion and export. Here, vector will collect the log data using docker_logs source and send to loki. The job file is given below.
datacenters = [“dc1”]
# system job, runs on all nodes
type = “system”
group “vector” {
count = 1
network {
port “api” {
to = 8686
}
}
ephemeral_disk {
size = 500
sticky = true
}
task “vector” {
driver = “docker”
config {
image = “timberio/vector:0.30.0-debian”
ports = [“api”]
volumes = [“/var/run/docker.sock:/var/run/docker.sock”]
}
env {
VECTOR_CONFIG = “local/vector.toml”
VECTOR_REQUIRE_HEALTHY = “false”
}
resources {
cpu = 100 # 100 MHz
memory = 100 # 100MB
}
# template with Vector’s configuration
template {
destination = “local/vector.toml”
change_mode = “signal”
change_signal = “SIGHUP”
# overriding the delimiters to [[ ]] to avoid conflicts with Vector’s native templating, which also uses {{ }}
left_delimiter = “[[“
right_delimiter = “]]”
data=<<EOH
data_dir = “alloc/data/vector/”
[api]
enabled = true
address = “0.0.0.0:8686”
playground = true
[sources.logs]
type = “docker_logs”
[sinks.out]
type = “console”
inputs = [ “logs” ]
encoding.codec = “json”
target = “stdout”
[sinks.loki]
type = “loki”
compression = “snappy”
encoding.codec = “json”
inputs = [“logs”]
endpoint = “http://[[ range nomadService “loki” ]][[.Address]]:[[.Port]][[ end ]]”
healthcheck.enabled = true
out_of_order_action = “drop”
# remove fields that have been converted to labels to avoid having the field twice
remove_label_fields = true
[sinks.loki.labels]
# See https://vector.dev/docs/reference/vrl/expressions/#path-example-nested-path
job = “{{label.”com.hashicorp.nomad.job_name” }}”
task = “{{label.”com.hashicorp.nomad.task_name” }}”
group = “{{label.”com.hashicorp.nomad.task_group_name” }}”
namespace = “{{label.”com.hashicorp.nomad.namespace” }}”
node = “{{label.”com.hashicorp.nomad.node_name” }}”
EOH
}
kill_timeout = “30s”
}
}
}
Copy the above configuration and deploy the job from Nomad UI.Once vector is deployed, it will start collecting the logs from docker logs and send it to Loki.
Deploy Grafana
Grafana is a popular tool to visualize logs, metrics and traces. Here we will use grafana and its Loki Data source connector to view and explore log data sent by docker applications running in Nomad.
The grafana nomad job file is given below.
datacenters = [“dc1”]
type = “service”
group “grafana” {
count = 1
network {
mode = “host”
port “grafana” {
to = 3000
static = 3000
}
}
task “grafana” {
driver = “docker”
env {
GF_LOG_LEVEL = “ERROR”
GF_LOG_MODE = “console”
GF_PATHS_DATA = “/var/lib/grafana”
}
user = “root”
config {
image = “grafana/grafana:10.4.2”
ports = [“grafana”]
volumes = [“/grafana_volume:/var/lib/grafana”]
}
resources {
cpu = 2000
memory = 2000
}
}
}
}
Deploy this job using the Nomad UI as described in previous section.
After deploying all the jobs, the Nomad UI looks like this.
Connecting to Loki Data source in Grafana
After confirming all jobs are running as expected, open the grafana UI on :3000. For me the address is my host machine’s private IP which is http://192.168.1.32:3000. Login to the Dashboard, using default username admin and password admin.
Select the Data sources option, press Add Data sources
Search for loki and select it
Update the connection URL of loki. Based on the loki nomad job file, it is listening on static port 3100. The connection url will be like this, http://(machine-ip):3100.
keep other options default and click on Save & Test
If the connection is successful, it shows Data source successfully connected.
Visualising Loki Logs in Grafana
Select the Explore option in Grafana
Select Loki
Select the Label jobs and choose logger Nomad job.
Click Run Query to view the logs
You have successfully installed Nomad, Docker, and run applications on top of it, and queried the logs emitted by that application in Grafana.
References
https://atodorov.me/2021/07/09/logging-on-nomad-and-log-aggregation-with-loki/
https://developer.hashicorp.com/nomad/docs

![Introduction to Docker Containers [With Commands]](https://media.dev.to/cdn-cgi/image/width=800%2Cheight=%2Cfit=scale-down%2Cgravity=auto%2Cformat=auto/https%3A%2F%2Fdev-to-uploads.s3.amazonaws.com%2Fuploads%2Farticles%2Fd8oklcpekix12dp929sj.png)
