
Ethereum’s price has undergone an extensive phase of sideways consolidation subsequent to a decline toward the critical support level of $3K.
Despite this, the cryptocurrency seems confined within a range between $3K and $3.7K, and it’s unlikely that volatility will pick up unless it manages to break out in either direction.
Technical Analysis
By Shayan
The Daily Chart
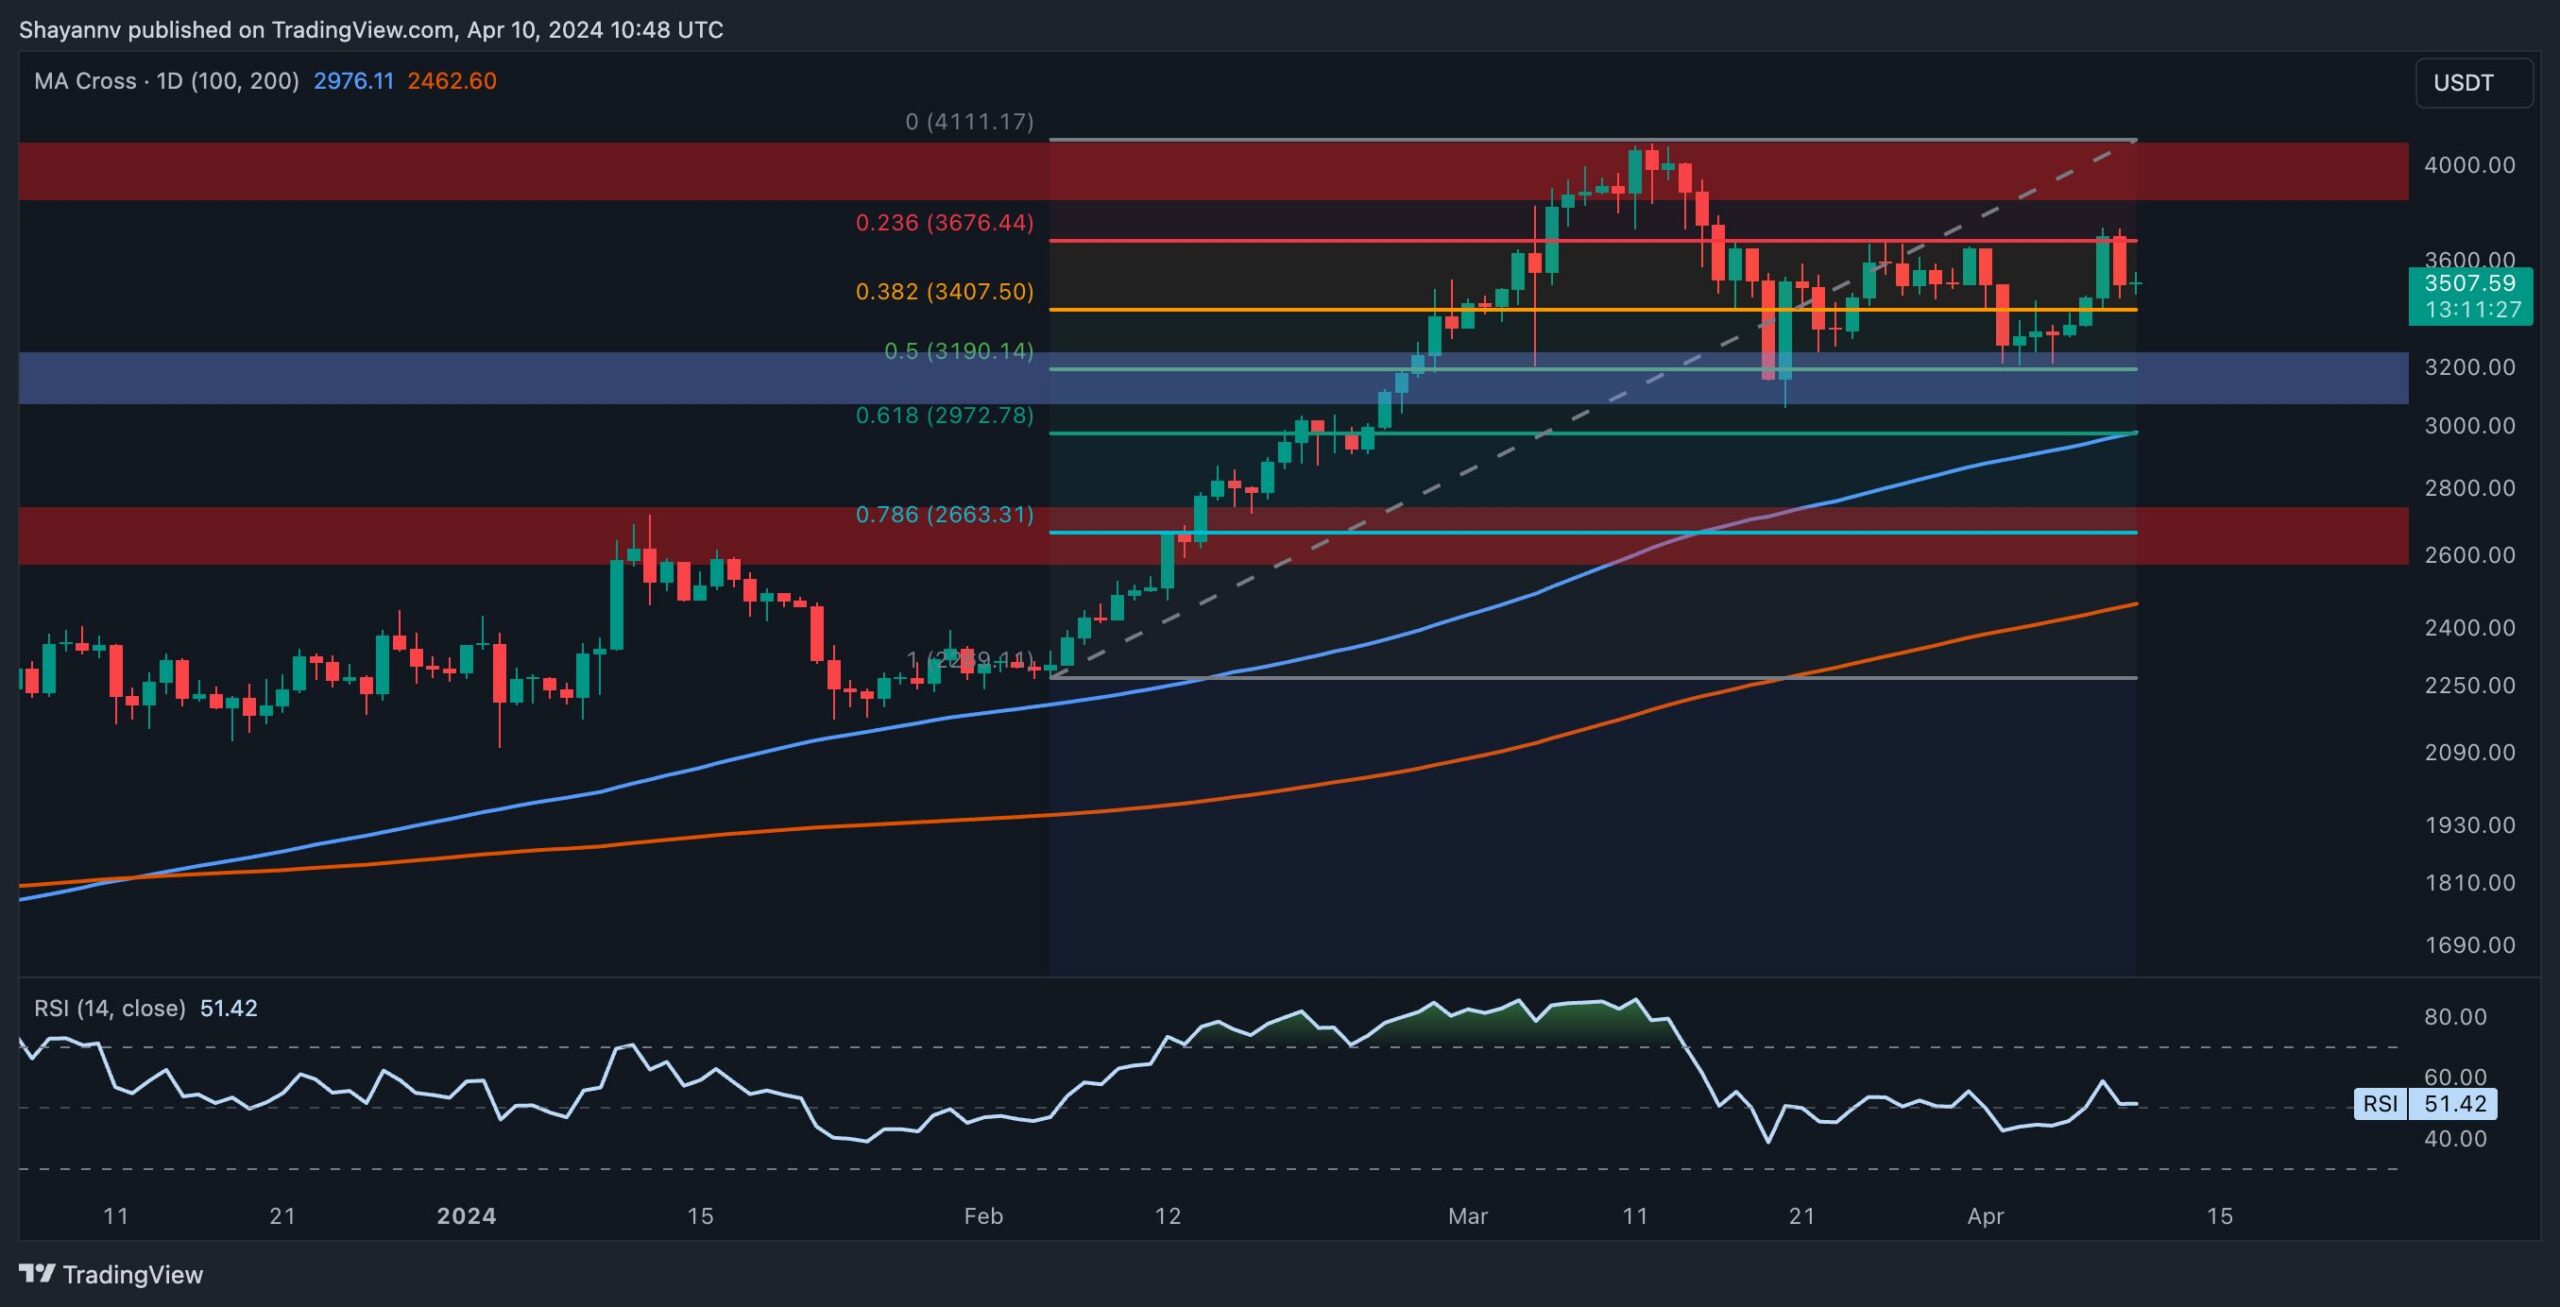
A comprehensive analysis of the daily chart reveals Ethereum’s prolonged sideways consolidation after finding substantial support around the $3K threshold. This zone aligns with significant Fibonacci retracement levels ranging between 0.5 ($3190) and 0.618 ($2972) alongside the pivotal 100-day moving average at $2972. This confluence of support levels spurred a rebound in ETH’s price, pushing it towards the upper boundary of the range at $3.7K.
However, recent price action has encountered resistance near the upper boundary of the range, suggesting the presence of sellers at this critical juncture.
Nevertheless, Ethereum remains in a phase of sideways consolidation, with market participants anticipating a bullish revival aimed at breaking above this crucial price range.
The 4-Hour Chart
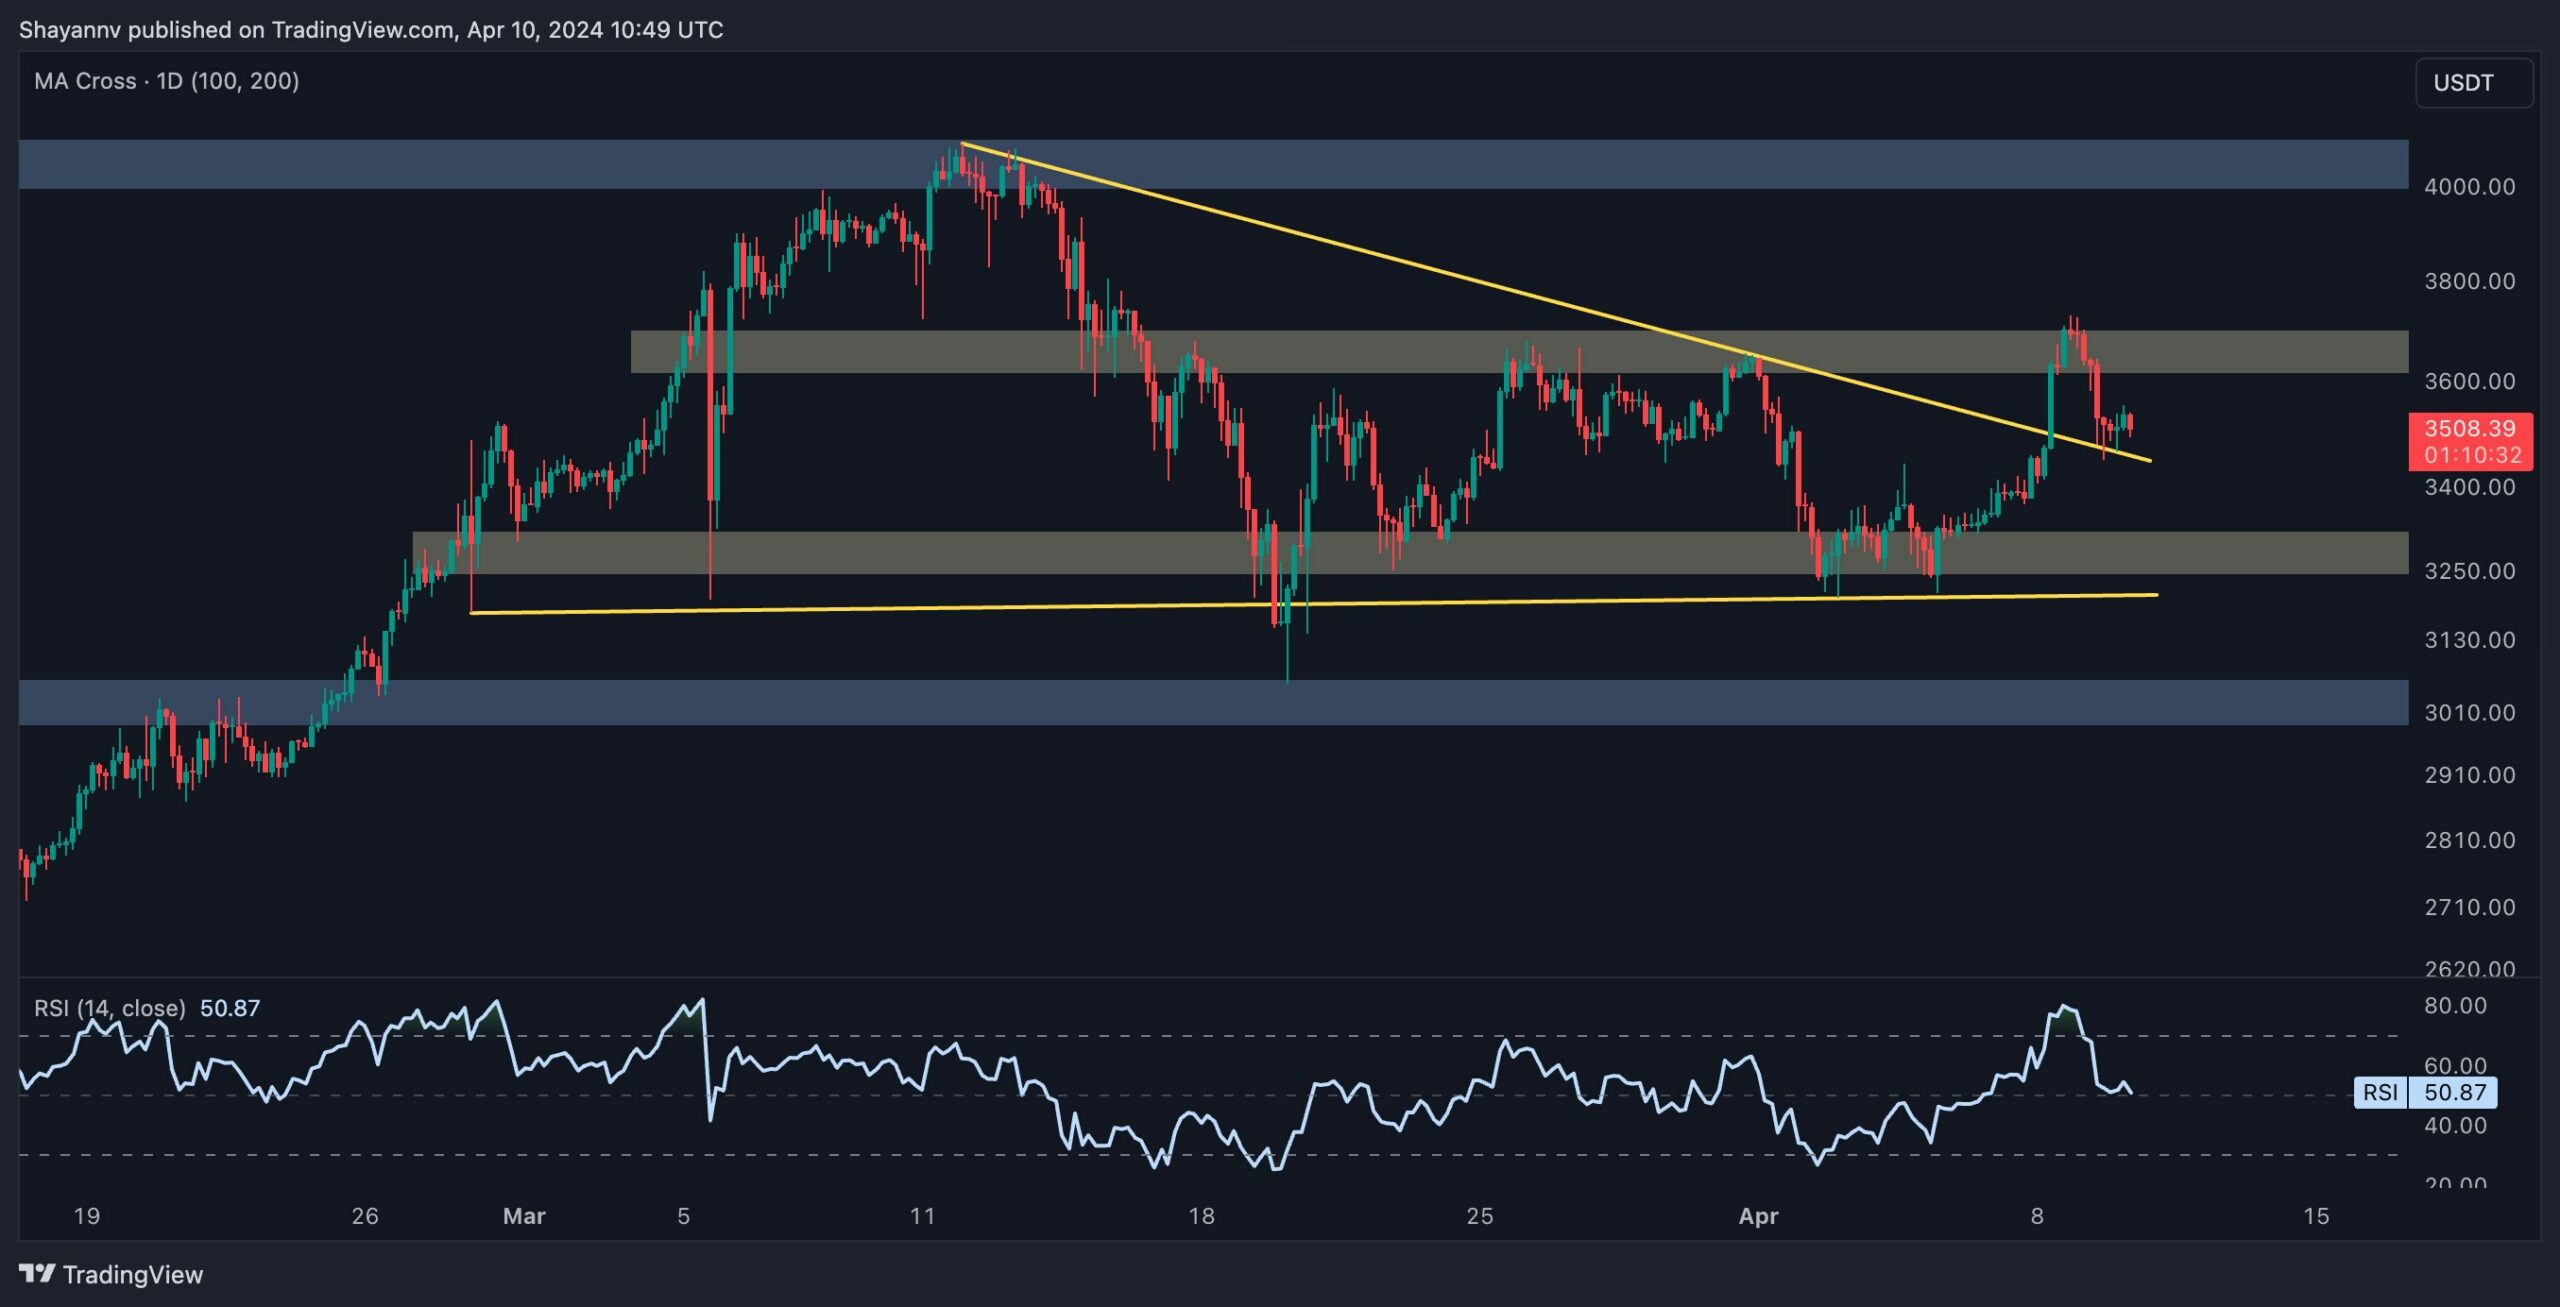
A closer examination of the 4-hour chart reveals the formation of a sideways wedge pattern during a period of corrective retracements. Typically, such patterns indicate a potential continuation of the bullish trend upon breakout from the upper boundary.
Despite this, Ethereum experienced significant buying pressure in the vicinity of the noteworthy $3K support region, resulting in a renewed bullish momentum that breached the upper boundary of the wedge.
This price action underscores the dominance of buyers in the market. However, upon reaching the resistance level of $3.7K, Ethereum faced rejection, triggering a slight retracement.
Currently, following this retracement, the price has returned to the broken level of the wedge, potentially completing a pullback. Should this pullback prove successful, Ethereum’s price is poised for another upswing, targeting the $3.7K threshold. Conversely, the possibility of a bearish retracement, with the next support level at $3.2K, cannot be ruled out.
On-chain Analysis
By Shayan
While Ethereum’s price has been showing signs of rebound, it would be beneficial to determine whether this is a result of spot buying pressure or leveraged futures positions.
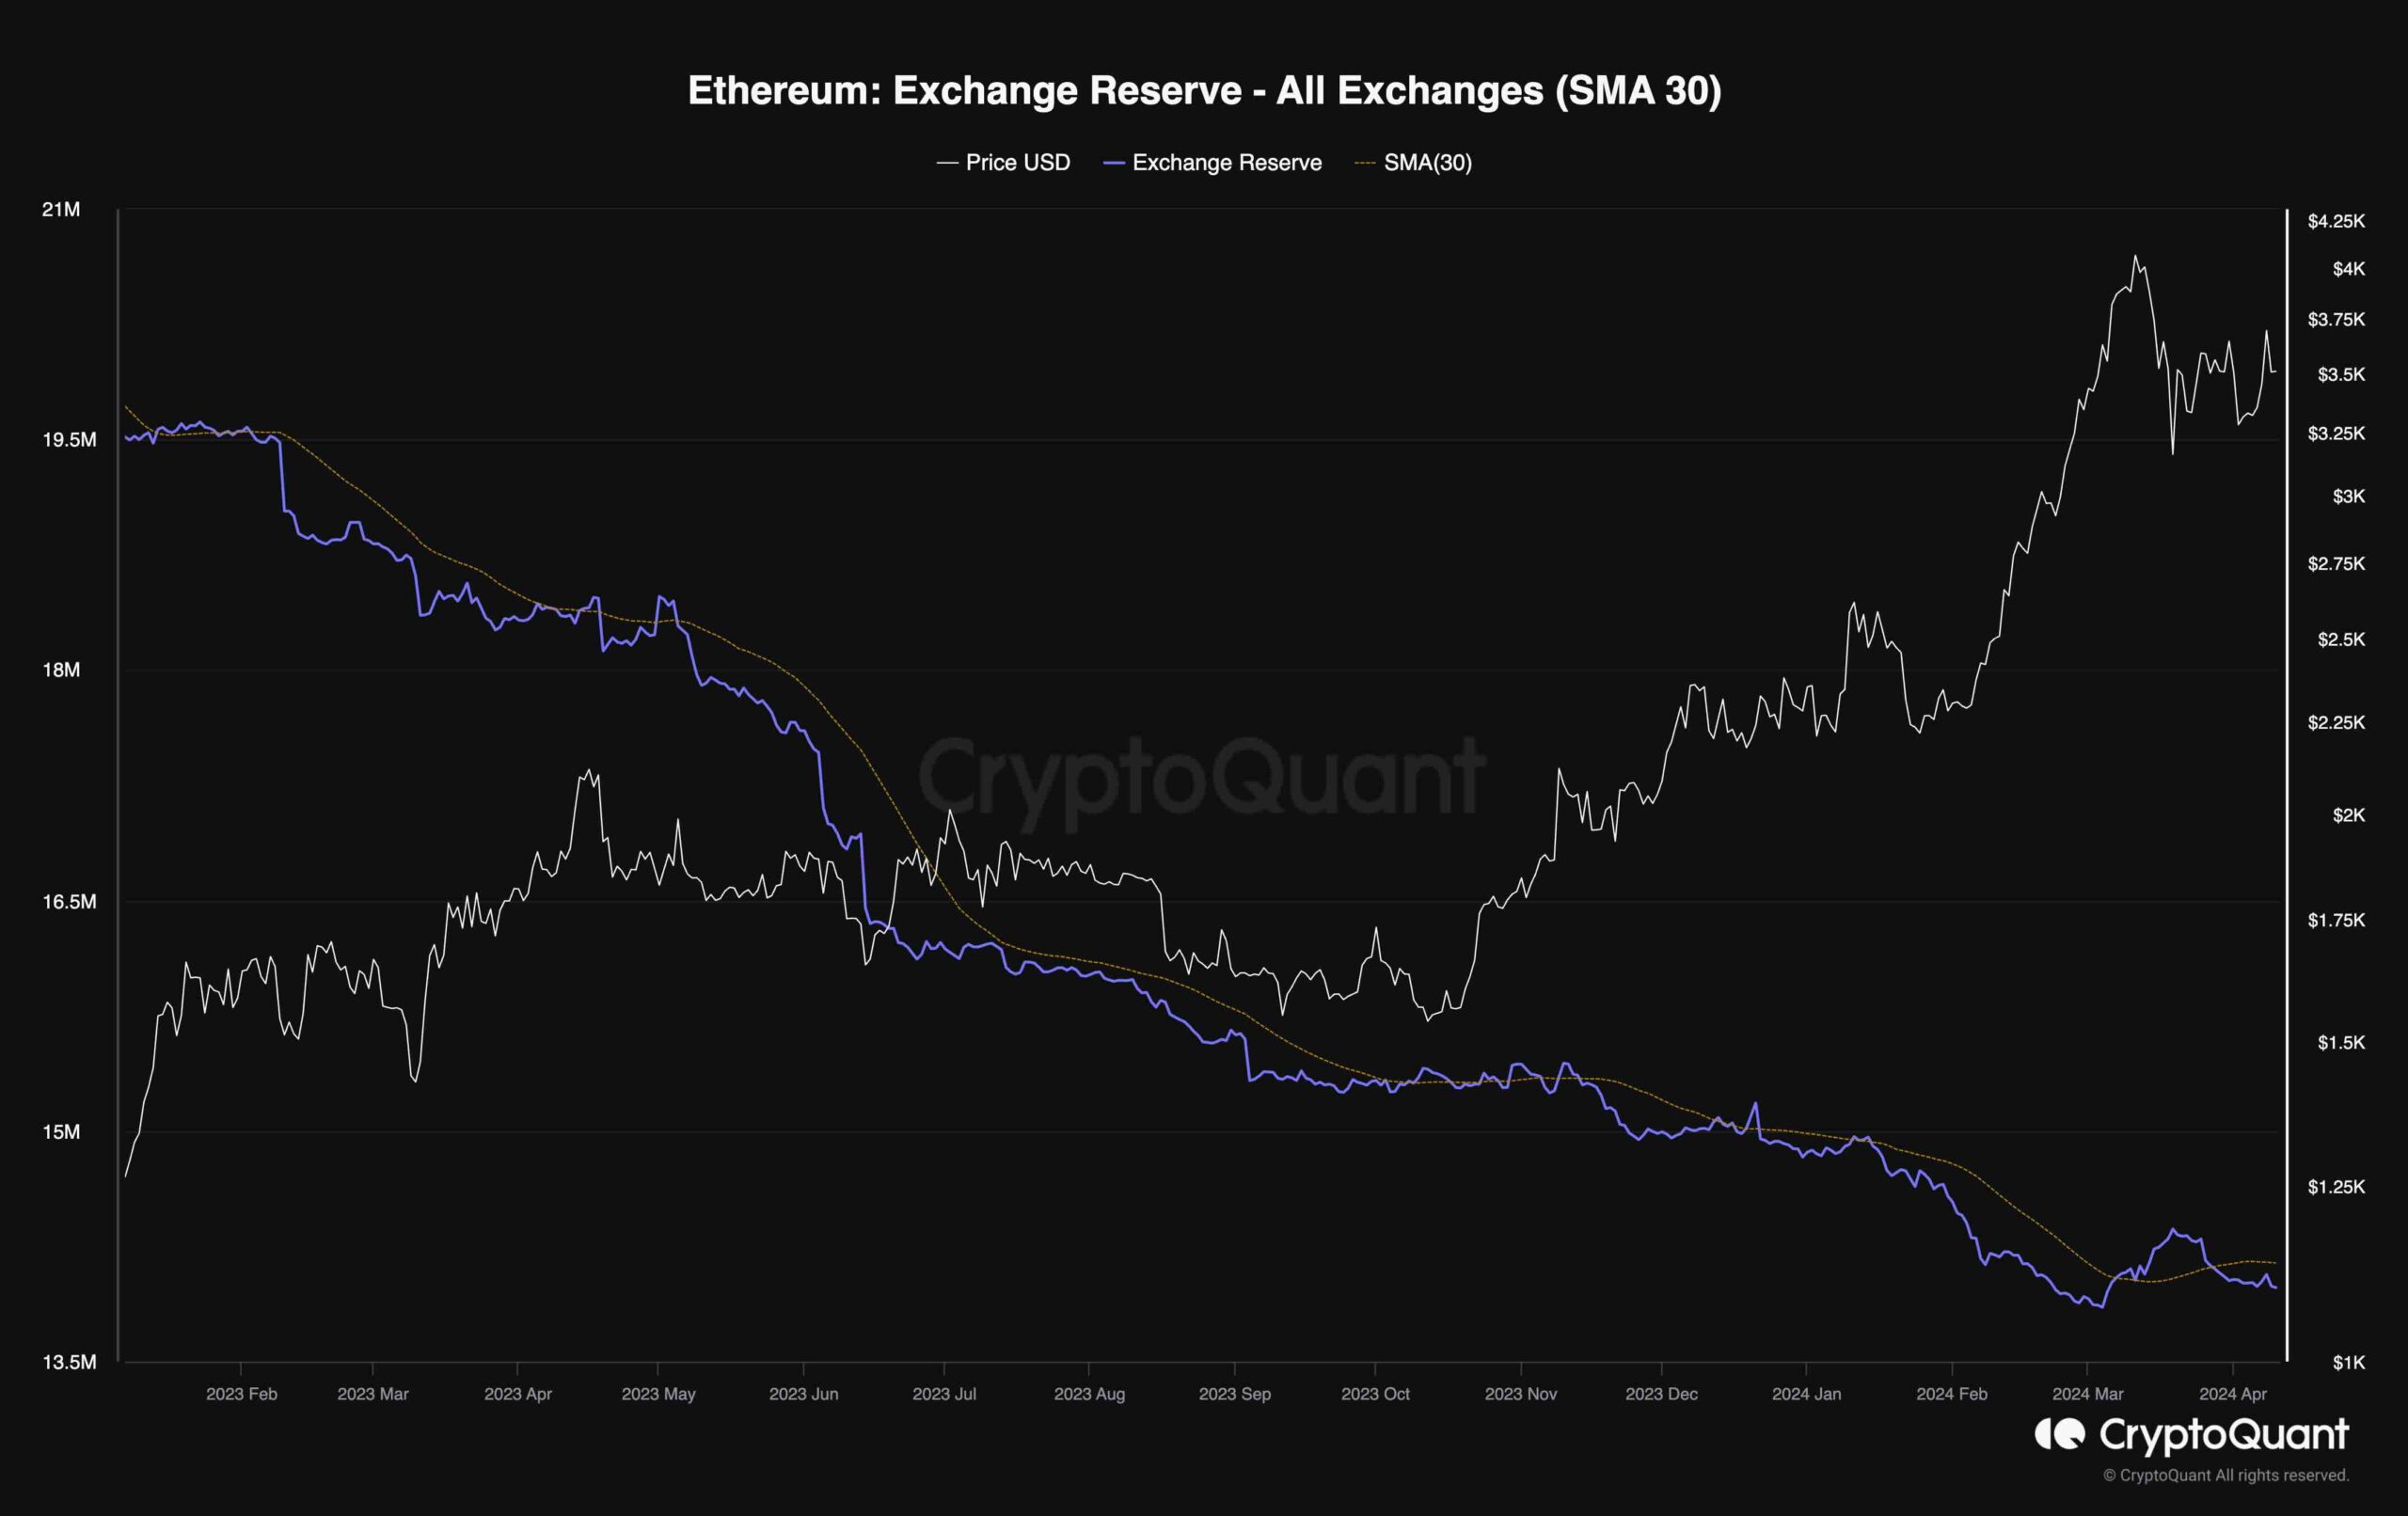
The following chart demonstrates the exchange reserve metric, which measures the amount of ETH held on exchange wallets.
It is evident that after a sharp increase above the 30-day moving average a few weeks ago, the exchange reserve metric has fallen below the MA once again. This indicates that investors have been withdrawing ETH from exchanges, which is a sign of spot buying pressure. Therefore, the spot market demand is playing a major role in a potential rally higher, which could result in a more sustainable uptrend.
The post ETH Slides Below $3.5K But Bullish Presence Remains Strong (Ethereum Price Analysis) appeared first on CryptoPotato.


