
DORA metrics help measure and improve the performance of software delivery teams. They help companies understand how well their engineering teams are performing in driving business value. Through these metrics, teams can identify bottlenecks in the software delivery process and help improve its effectiveness. DORA metrics are foundational for companies seeking to implement value stream management (VSM) initiatives.
This tutorial will explain the four DORA metrics, address the questions they answer, and examine how DORA metrics are instrumented within the CloudBees platform. This blog targets engineering managers seeking more visibility into how their software delivery efforts impact business performance.
UI overview
Before moving into each widget, let’s discuss some common UI elements:
Filtering: Use the filters to choose the component and the duration for which I want to see flow metrics down to the component level. When filtering, please note that weeks run from Monday to Sunday.
Drill downs: You can click any data point in the bold blue font for a deeper dive.
Hovering: Each report has a tooltip explaining its coverage. You can hover over each graph type to get a breakdown.
Viewing: All CloudBees platform pages can be viewed in either light or dark mode. We use dark mode for this post.
DORA metrics have been studied for several years and, thus, act as a benchmark to help organizations determine where they fit, broken down from elite to low performers. All teams are different in terms of what level they strive to achieve. When setting your software delivery goals, you must know your current status and incorporate measures to help you progress in your performance metrics.
DORA metrics in the CloudBees platform
DORA metrics within the CloudBees platform are available at the organization, sub-organization, or component level.
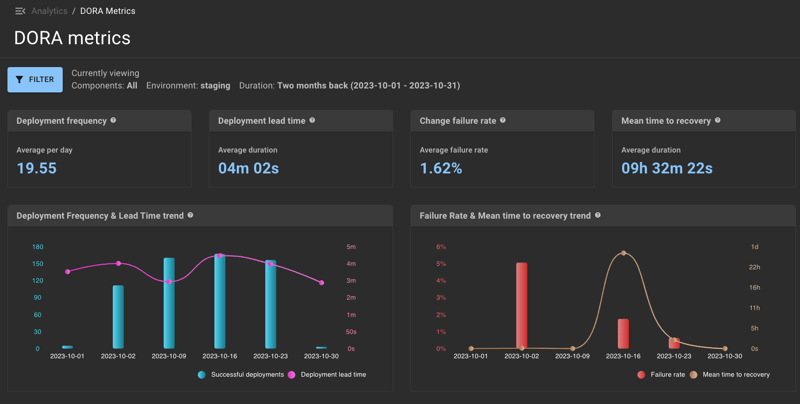
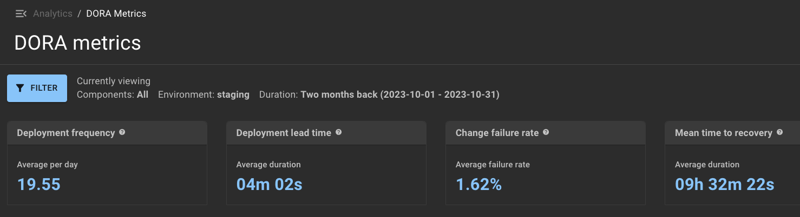
Let’s start by zooming in on the top row where the four DORA metrics are displayed.
Deployment frequency
Deployment frequency helps answer questions about how often software deployments are made to production. Overall, deployment frequency provides valuable insights into the team’s agility, speed, and ability to release software to production, helping teams identify opportunities to optimize their release process and deliver new features and fixes more quickly and reliably.
In our example, we average 19.55 deployments per day. As a software vendor developing a new product, it makes sense to have such a high frequency when adding core functionality.
While increasing deployment frequency indicates an agile team, ensuring you are deploying the right features is vital. Thus, ensuring deployment frequency isn’t measured in isolation is necessary for optimal outcomes.
When benchmarking performance:
Elite Performers: Multiple times a day
High Performers: Once a week to once a month
Medium Performers: Once a month to once every six months
Low Performers: Less than once every six months
Deployment lead time for changes
Lead time for changes measures the time it takes for a code change to be implemented and deployed to production. It provides valuable insights into the team’s efficiency and speed in implementing and deploying changes, helping teams identify areas for improvement and optimize their development and release process to reduce lead time and improve customer satisfaction.
Our example shows a deployment lead time for changes of four minutes and two seconds. This number will likely increase as the product matures and the team grows. Engineering managers should be aware of several factors that could lead to slower lead time for changes, such as:
Poor communication: Projects often involve large, dispersed teams, which can lead to misunderstandings of requirements. As a manager, you can reduce this likelihood by creating appropriate-sized and centralized teams.
Tech debt: impacts lead time as old issues must be addressed.
Lack of automation: manual building, testing, and deploying processes can significantly slow lead time. Ensure automation is incorporated as necessary to help.
Lack of resources: if a team needs more resources (people or infrastructure), this can slow down the deployment process.
Regulatory compliance: Highly regulated industries often require additional rigorous checks before deployment, impacting the lead time.
When benchmarking performance:
Elite Performers: Less than one hour
High Performers: One day to one week
Medium Performers: One month to six months
Low Performers: More than six months
Change failure rate (CFR)
Change failure rate provides valuable insights into the reliability of the team’s release process and the quality of their releases. Low failure rates are desirable. For example, a 10% change failure rate indicates that 10% of all changes made to the system failed.
These insights help engineering managers identify areas for improvement and optimize their release process to reduce the risk of failed changes and improve customer satisfaction. For example, a high CFR may indicate that too many changes are being introduced simultaneously. High CFR also raises the question of investment in tooling and infrastructure. If the change failure rate continues to be high, there’s also a cultural impact on morale, leading to lower developer productivity.
When benchmarking performance:
Elite Performers: 0-15%
High, Medium, and Low Performers: 16-30%
Mean time to recovery (MTTR)
MTTR provides valuable insights into the effectiveness of the team’s incident response process, helping identify areas for improvement and optimize their incident management process to reduce downtime and improve customer satisfaction. Teams should strive to make this number as low as possible. MTTR helps address questions such as:
How quickly can development teams respond to and recover from incidents?
How effective is the team’s incident management process?
How much downtime does the team experience?
When benchmarking performance:
Elite Performers: Less than one hour
High Performer: Less than one day
Medium Performers: One day to one week
Low Performers: Over six months
Additional insights
The DORA reports section of the CloudBees platform goes beyond the four metrics. We also offer two trend reports to provide teams with additional insights.
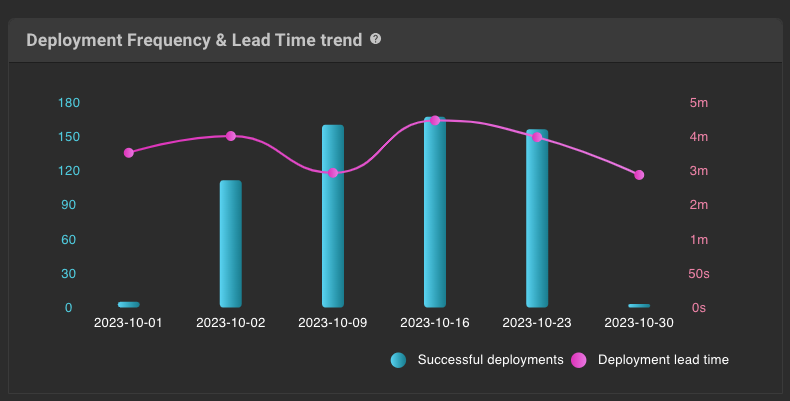
Deployment frequency and lead time trend
This widget tracks the number of deployments and lead time for the selected date. These two metrics work together for the following purposes:
Assessing Efficiency: A high deployment frequency coupled with a short lead time for changes indicates an efficient and effective software delivery process—teams can frequently deliver small, manageable changes with minimal delay.
Identifying Bottlenecks: If deployment frequency is high but lead time for changes is also high, it may indicate that while the team is deploying often, it’s taking a long time for those changes to go from idea to deployment. This could point to development, testing, or deployment bottlenecks.
Balancing Speed and Stability: If deployment frequency is low but the lead time for changes is also low, it suggests that the team is focusing on delivering large batches of changes quickly. This could lead to a risk of instability or issues in production. Balancing the two metrics can help achieve speed and stability in the delivery process.
By monitoring both deployment frequency and lead time for changes, software delivery teams can better understand their delivery process, identify areas for improvement, and make more informed decisions about optimizing their workflow.
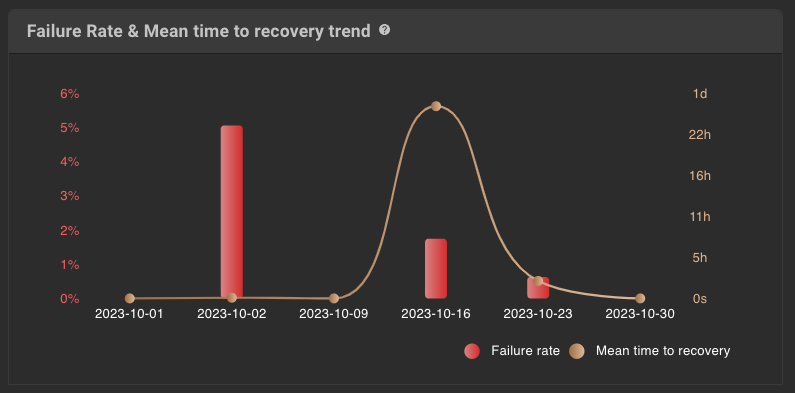
Failure rate and mean time to recovery trend
This widget tracks the number of failed deployments and the mean time to recovery (MTTR) for the select dates. These two metrics work together for the following purposes:
Identifying Problem Areas: A high failure rate and a high MTTR could indicate serious problems with the system’s reliability and resilience. This might suggest the need for a thorough review and overhaul of the system.
Improving System Design: Understanding the relationship between failure rate and MTTR can help teams design better systems. For example, if the failure rate is high but MTTR is low, it might be due to frequent minor issues that are quickly resolved. This could lead to a focus on improving overall software quality to reduce the number of minor issues.
Balancing Resources: If the failure rate is low but MTTR is high, it might indicate that while the system is generally stable, significant issues take a long time to resolve. This could suggest the need for more resources to be put into faster problem detection and diagnosis or building more robust recovery mechanisms.
By monitoring and understanding both the failure rate and MTTR, software delivery teams can gain valuable insights into their system’s performance, identify areas for improvement, and make informed decisions about where to invest resources for the most significant impact.
Configuring DORA metrics in the CloudBees platform
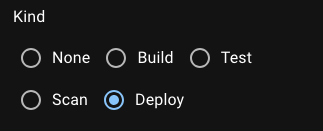
As of March 2024, DORA metrics rely on users tagging steps as Deploy within the Kind operator. Once applied, all data will funnel into the tabs. To learn more about this, visit our documentation.
Next steps
The CloudBees platform offers organizations a quick way to access DORA metrics, with granularity down to the organization, sub-organization, and component level. Equipped with this information, engineering managers can track the progress of delivering business impact with the ability to communicate this upstream efficiently.
With the information provided throughout this blog, you should better understand DORA metrics, how to set them up, and how to interpret the results. Now, it’s time to get started. Try the CloudBees platform for free to put these steps into practice. For complete documentation on DORA metrics, click here.
To learn more about additional CloudBees analytics reports, visit the below documentation.

