
Polkadot’s price has been dropping rapidly over the last couple of months and is yet to show any sign of slowing down. However, the cryptocurrency might soon begin a bullish rebound.
Technical Analysis
By TradingRage
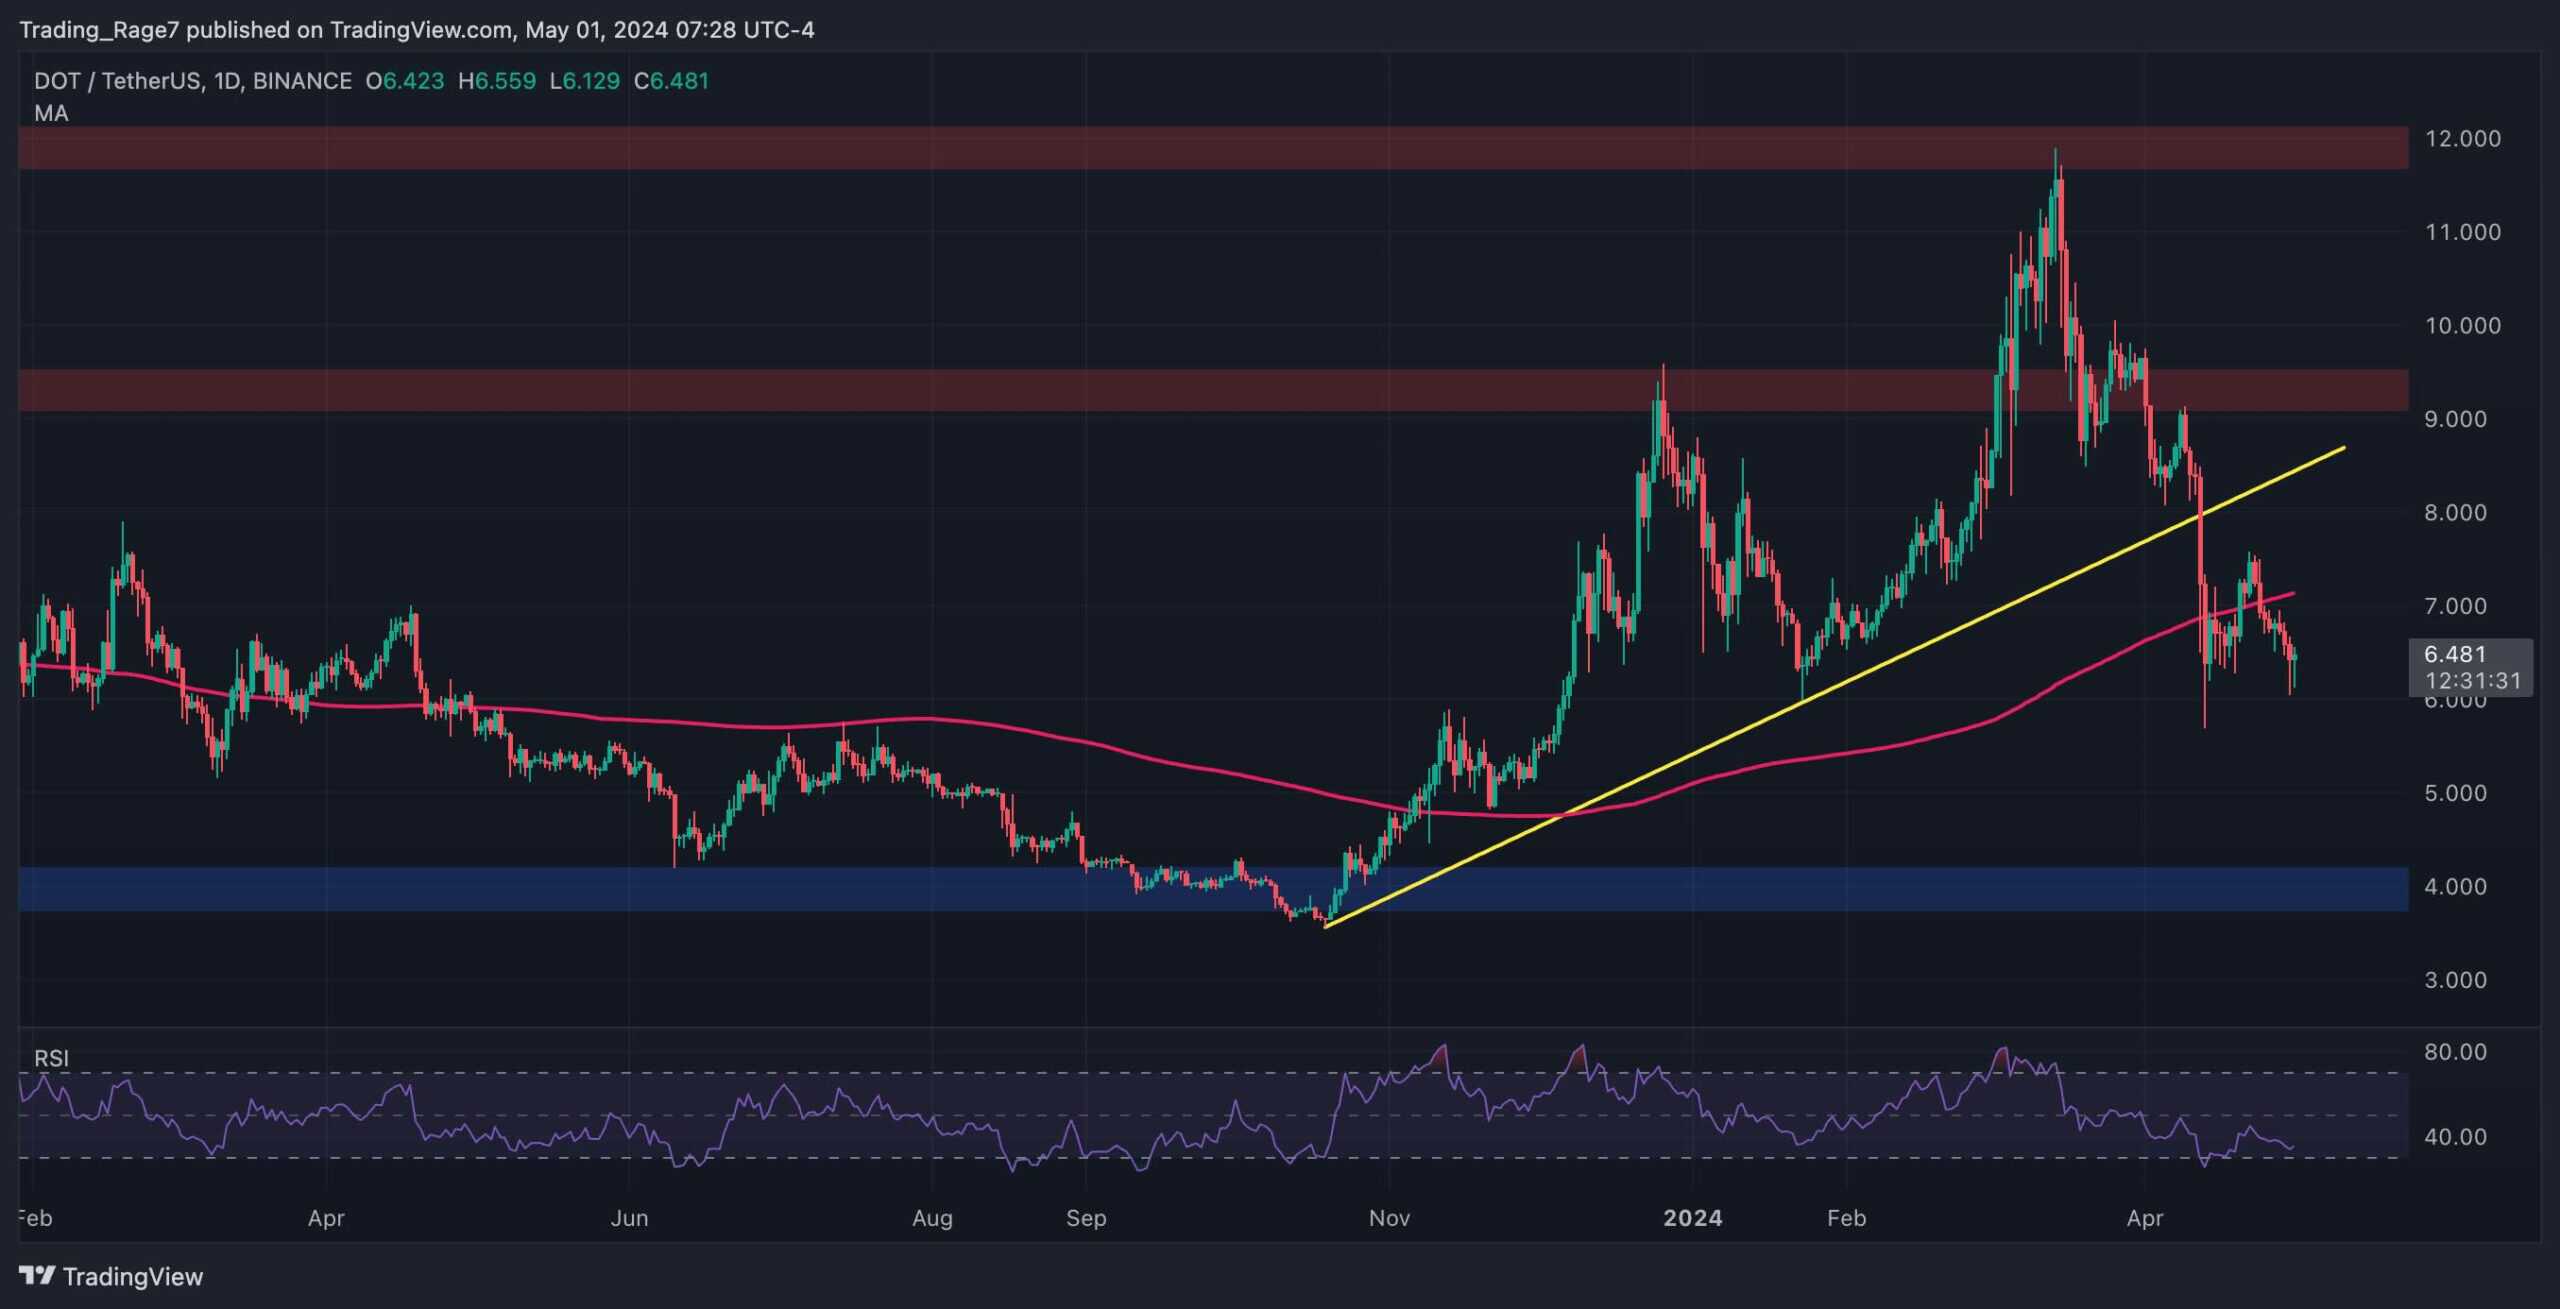
The Daily Chart
On the daily chart, the price has been on an aggressive decline since a rejection from the $12 resistance level. The market has also broken below the bullish trendline that has been formed since October 2023.
The 200-day moving average, located around the $7 mark has also been broken down, with the price seemingly targeting the $4 support zone.
With the Relative Strength Index also showing values below 50%, the momentum is in favor of a further bearish continuation.
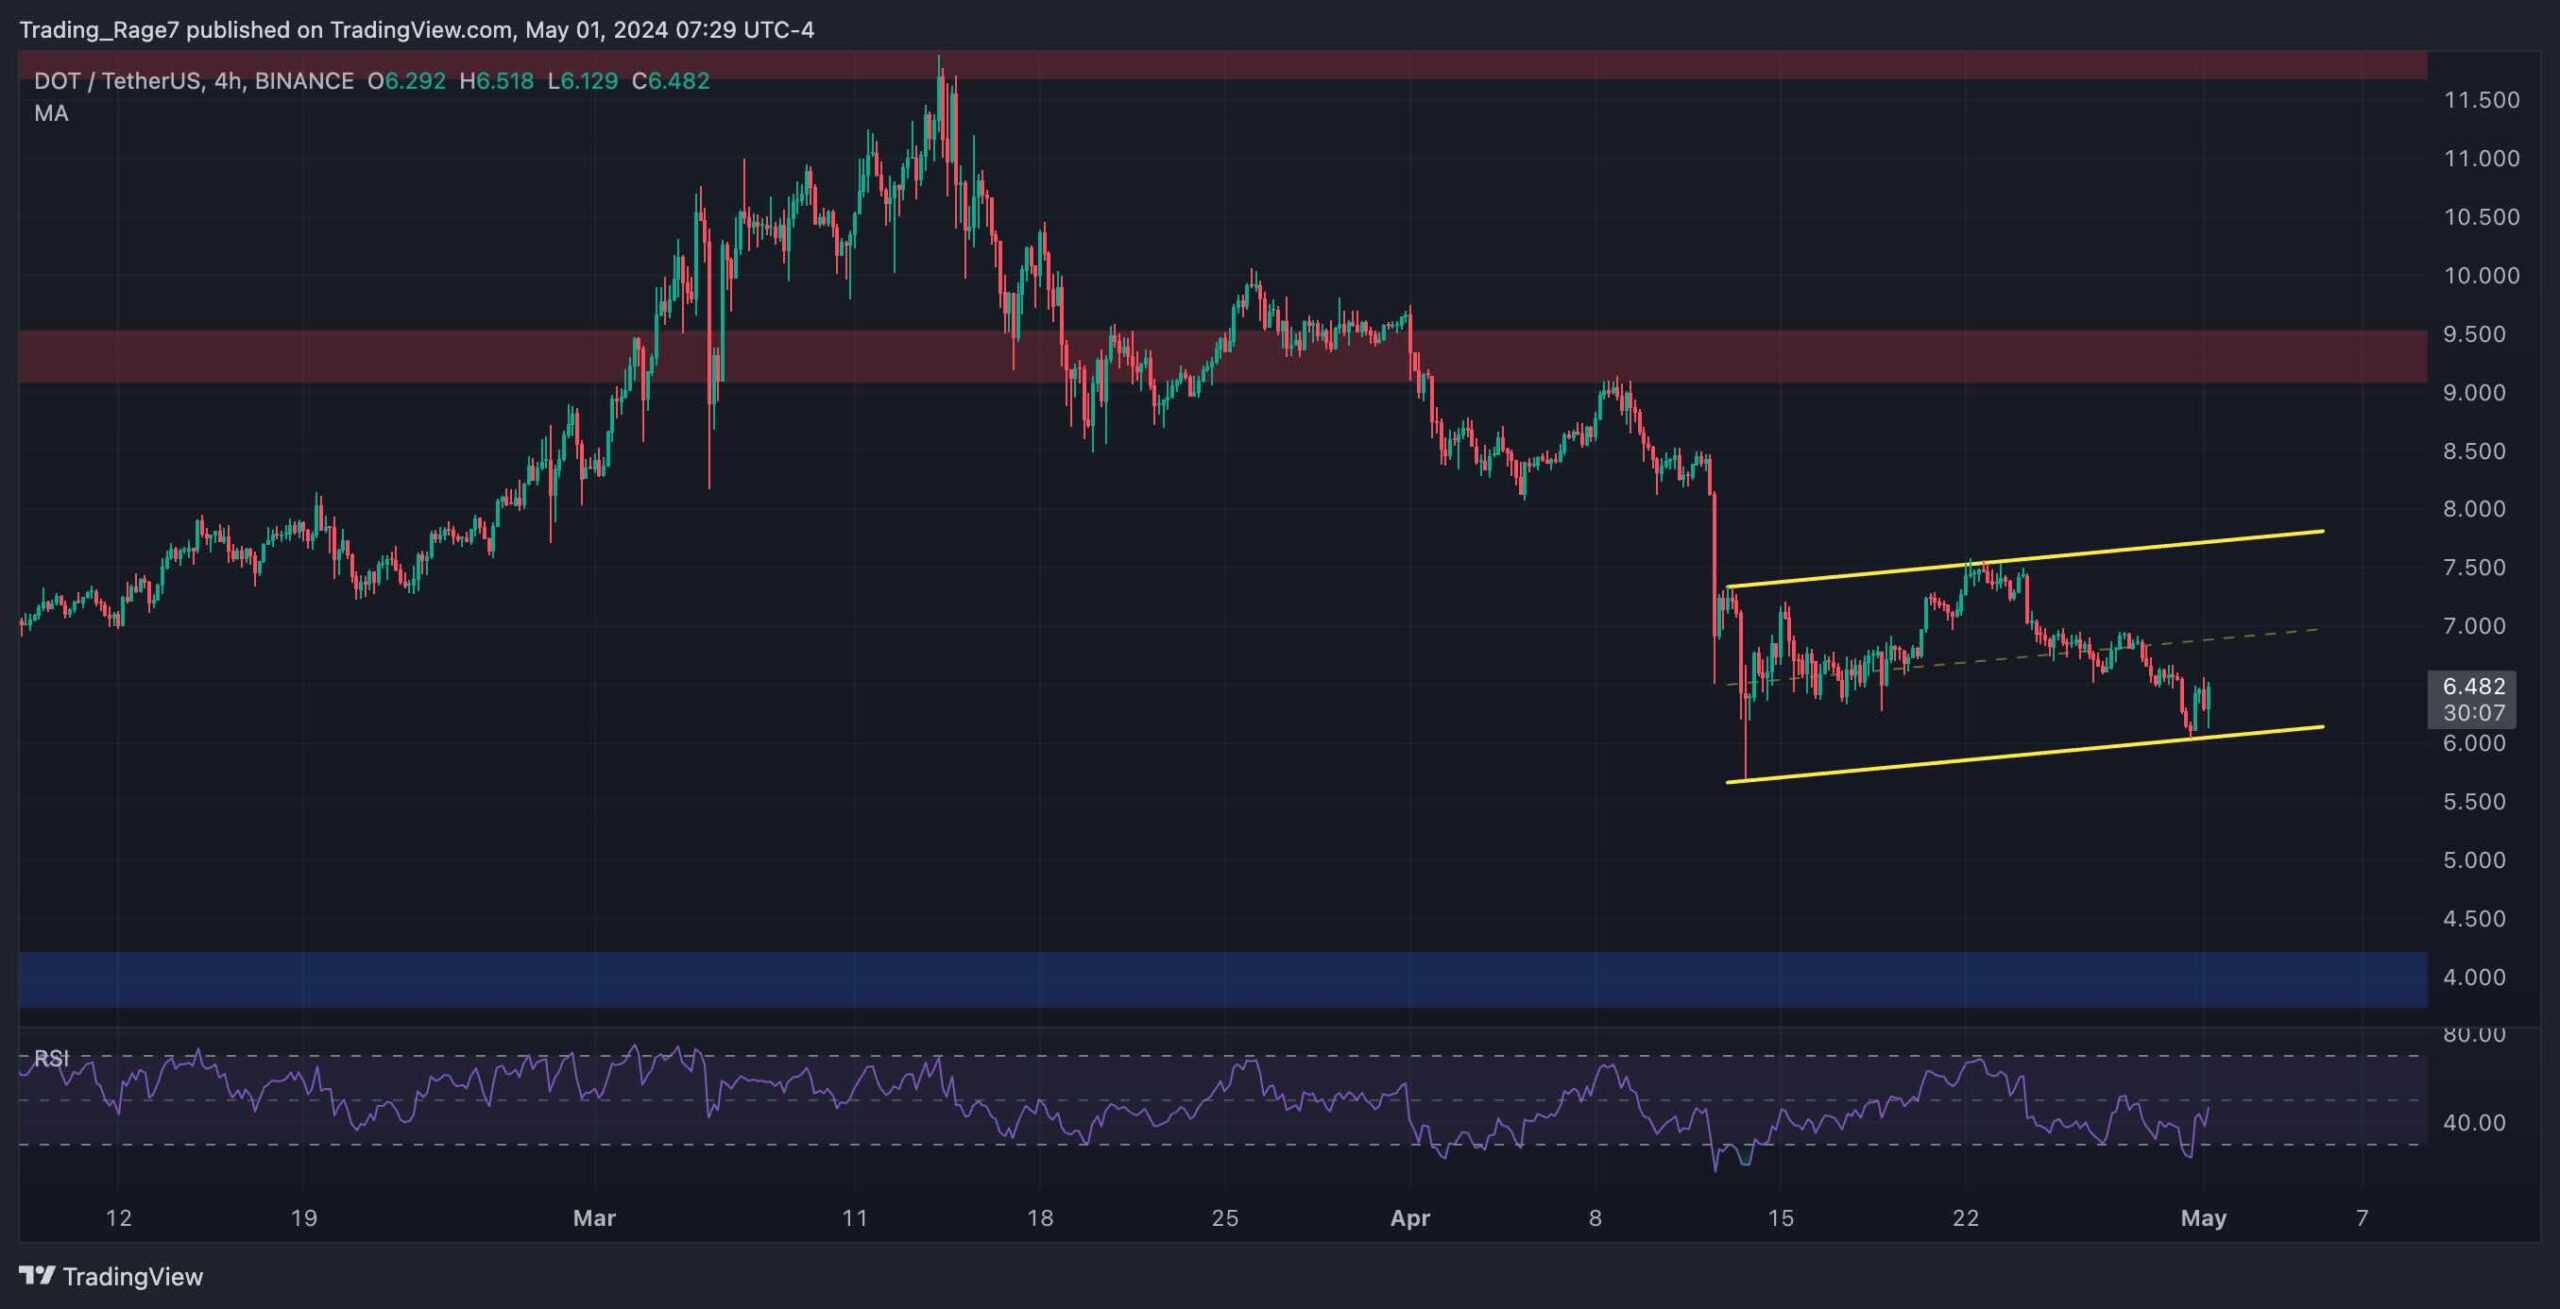
The 4-Hour Chart
The 4-hour chart paints a much more clear picture of the recent price action. The market is seemingly forming an ascending channel pattern at the moment.
These formations are normally considered bearish continuation patterns inside a larger downtrend.
Therefore, if the channel breaks down, the market would be more likely to crash toward the $4 support zone. On the other hand, a breakout above the channel can completely overturn the scenario, and the market could begin a bullish trend.
Therefore, the short-term fate of the market relies heavily on whether the channel is broken to the upside or downside.
Sentiment Analysis
By TradingRage
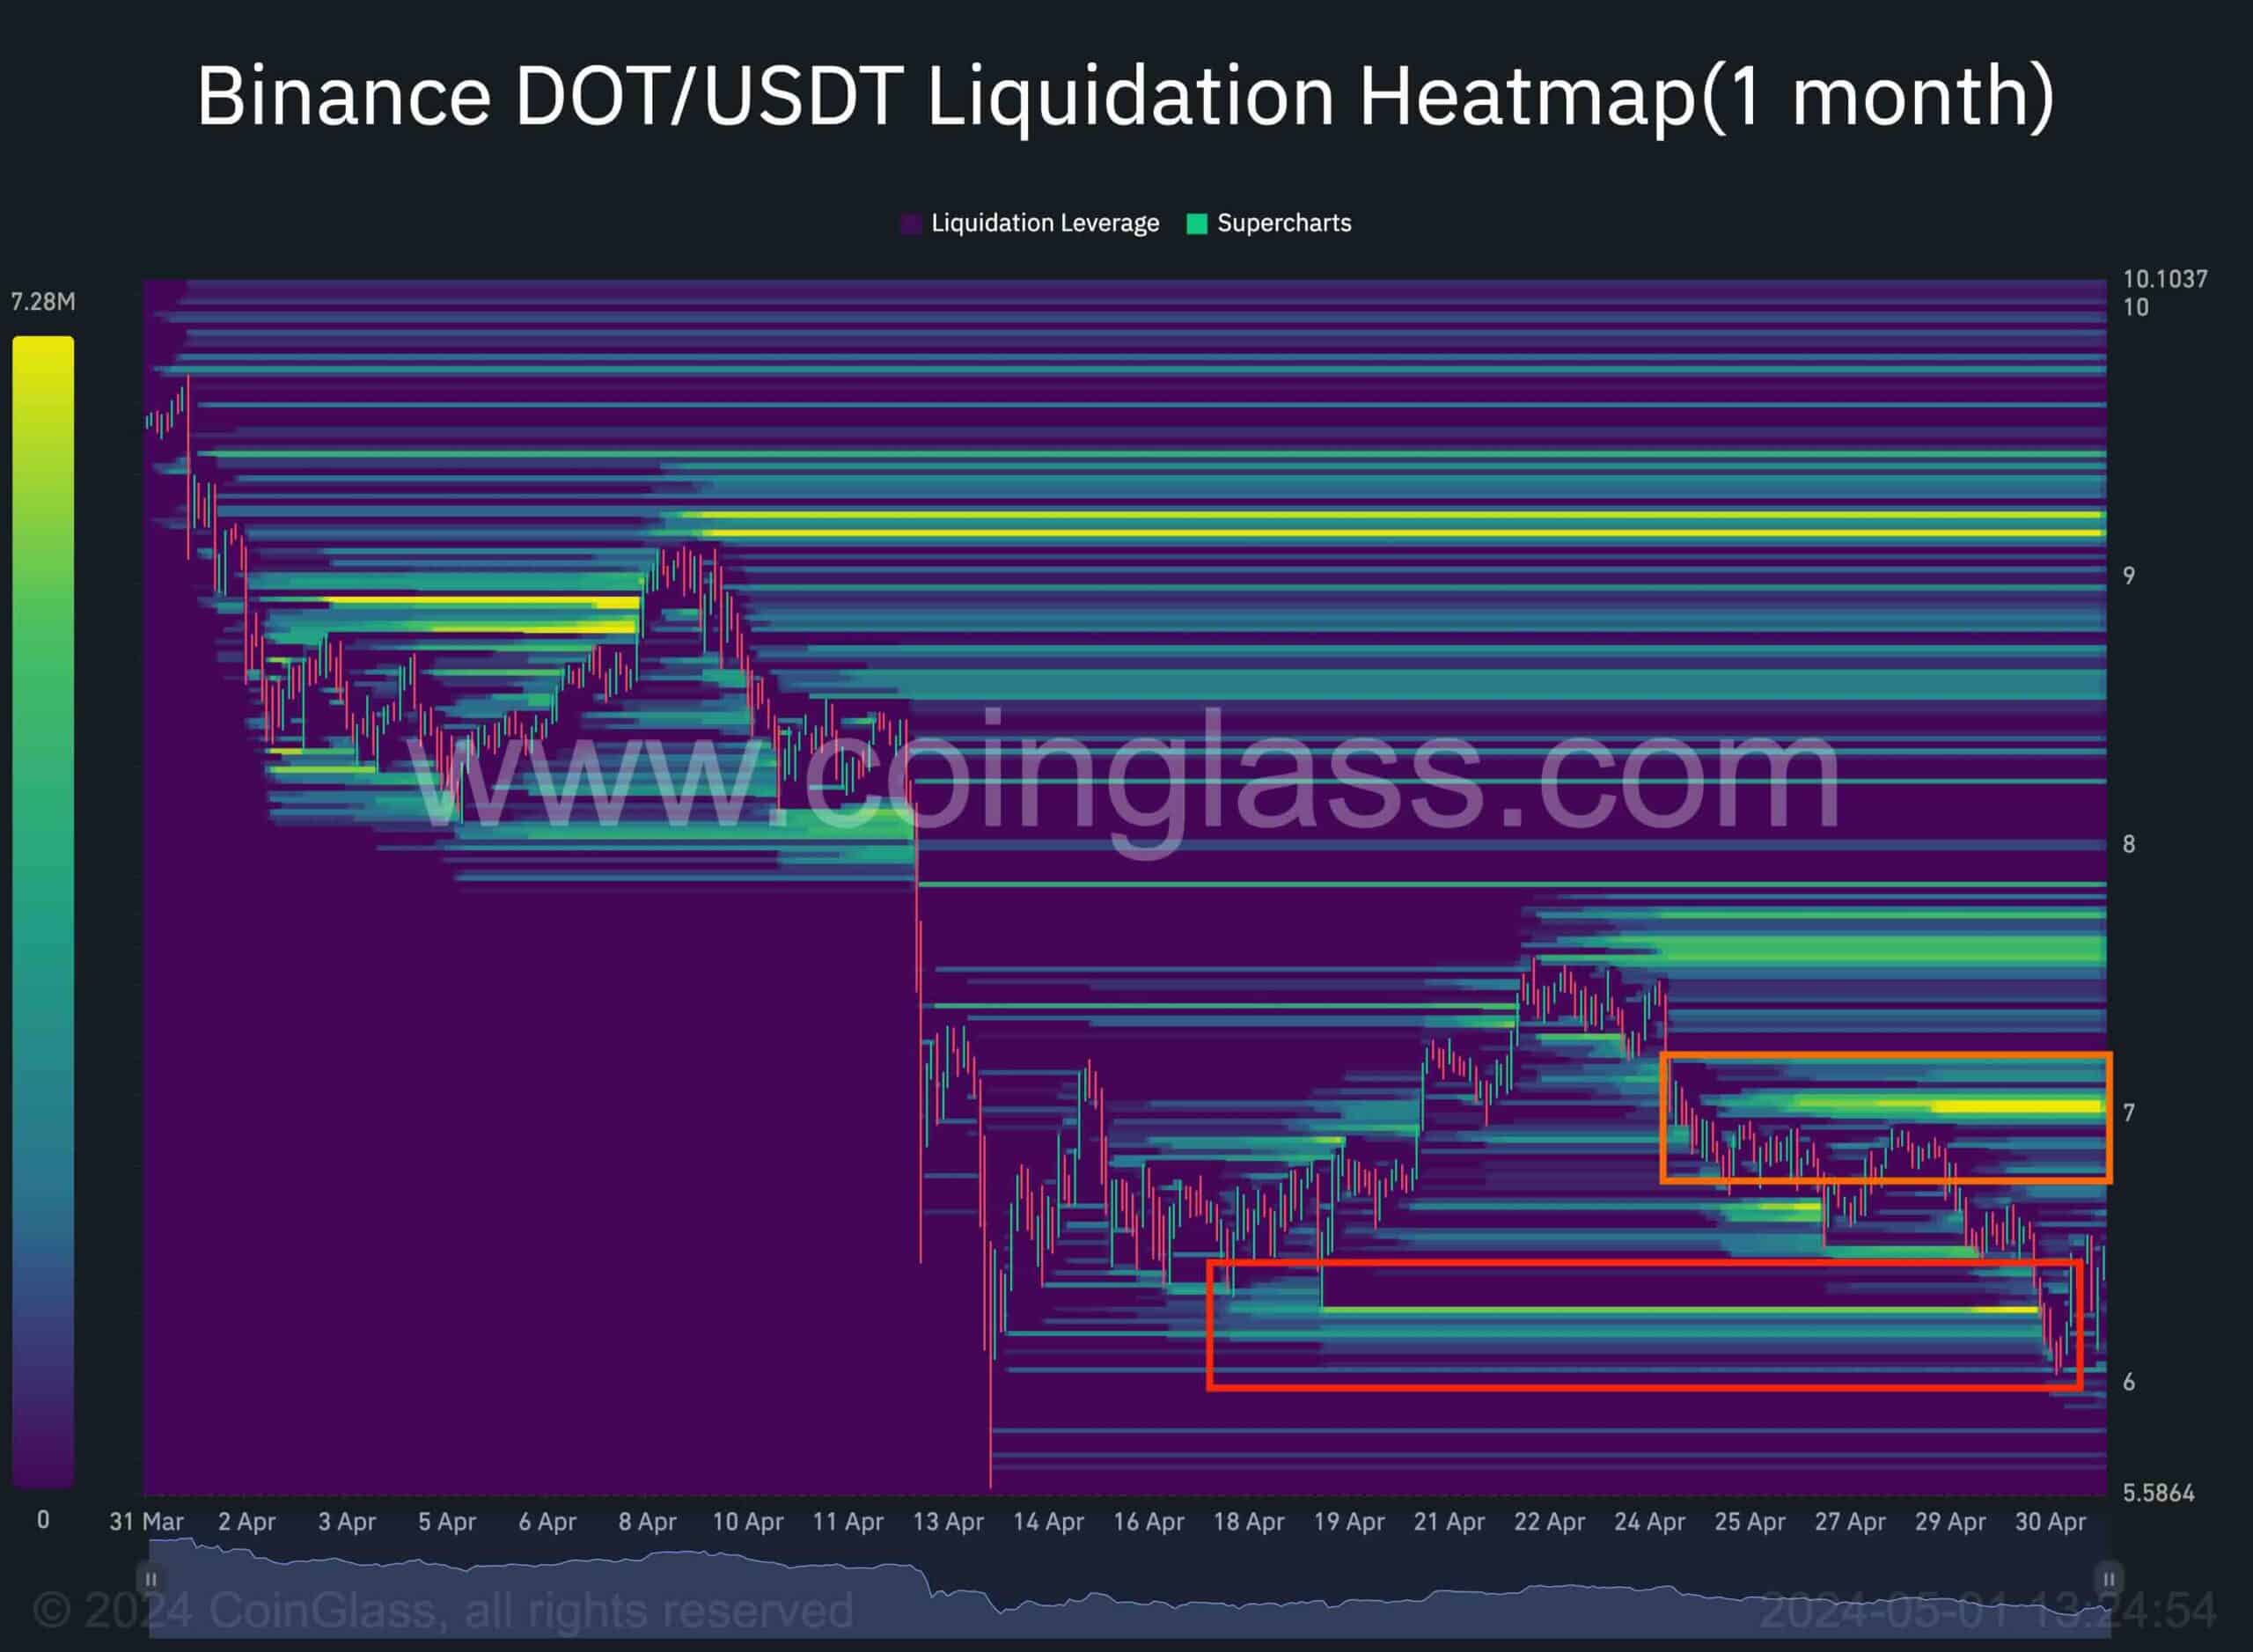
Polkadot Liquidation Heatmap
While the technical analysis of the DOT price chart suggests that we are in a clear bearish trend, the futures market data hints at a potential rebound in the short term.
This chart demonstrates the Binance DOT/USDT pair’s liquidation heatmap. It is evident that tons of liquidity were located below the $6.5 level, which the price has recently dropped below. Therefore, it could be interpreted that the demand has absorbed this supply as the market is not dropping lower anymore.
Currently, a potential liquidity pool for the price to target is located above the $7 level. As a result, the price could at least experience a short-term pullback toward this level.
The post Polkadot Price Analysis: DOT Tumbles 7% Weekly but the Bulls May Be Staging a Comeback appeared first on CryptoPotato.


