
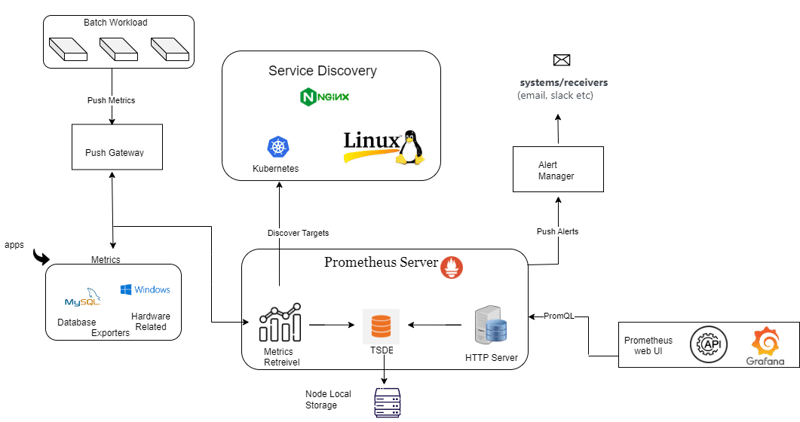
The Prometheus server is the core component responsible for scraping, storing, and querying metrics data.
The Prometheus server is designed for reliability and scalability, allowing it to handle large volumes of metrics data from numerous targets.
Here’s a breakdown of its functionalities:
Data Scraping:
The Prometheus server regularly scrapes metrics data from configured targets.
It supports various protocols like HTTP, HTTPS, and SNMP for scraping metrics endpoints
Prometheus Configuration File:
The Prometheus configuration file is where you define the targets to scrape, the time intervals for scraping, and other configuration settings.
The Prometheus configuration file is written in YAML format and defines various aspects of Prometheus’ behavior.
Global Configuration:
The global configuration section contains settings that apply globally to Prometheus.
This includes parameters like the scrape interval, which determines how often Prometheus scrapes metrics from targets.
scrape_interval: Defines the interval at which Prometheus scrapes metrics data from targets.
evaluation_interval: Specifies the interval at which Prometheus evaluates alerting rules.
Scrape configuration defines the targets that Prometheus should scrape for metrics data.
Each scrape configuration specifies a job name and a list of targets to scrape. These targets could be specific endpoints or services
job_name: Identifies a logical group of targets.
static_configs: Defines static targets to scrape, such as specific IP addresses and ports


