

XRP price is struggling to recover above the $0.520 resistance. The price could gain bearish momentum if it breaks the $0.50 support.
XRP is attempting a fresh increase and facing hurdles near $0.520.
The price is now trading near $0.5150 and the 100 simple moving average (4 hours).
There is a major bearish trend line forming with resistance at $0.520 on the 4-hour chart of the XRP/USD pair (data source from Kraken).
The pair could gain bullish momentum if there is a close above the $0.520 resistance.
XRP Price Aims Upside Break
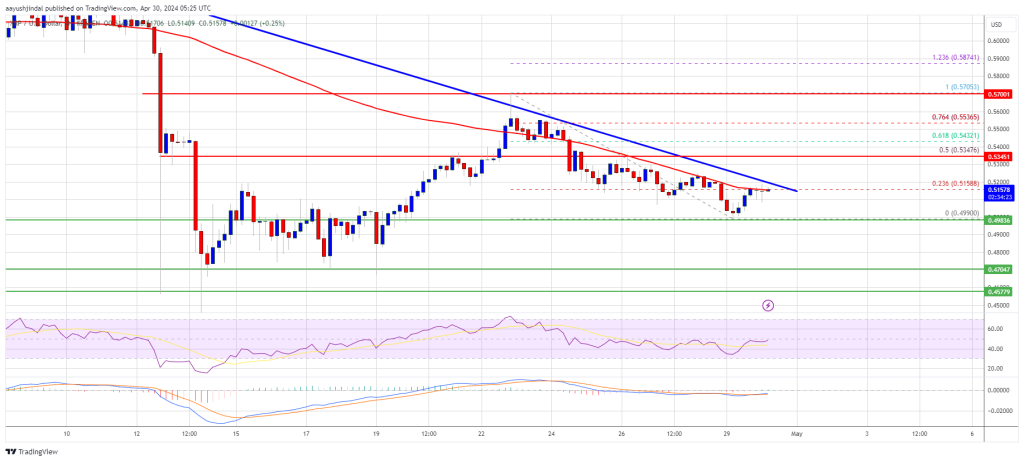
Recently, XRP price climbed above the $0.550 resistance and tested $0.570. A high was formed at $0.5705 before there was a pullback like Bitcoin and Ethereum. The price dipped below the $0.5250 support zone.
It even spiked below $0.500 and tested $0.4980. A low was formed at $0.4990 and the price is now consolidating near the 23.6% Fib retracement level of the downward move from the $0.5705 swing high to the $0.4990 low. It also trades near $0.5150 and the 100 simple moving average (4 hours).
Immediate resistance is near the $0.520 level. There is also a major bearish trend line forming with resistance at $0.520 on the 4-hour chart of the XRP/USD pair.
Source: XRPUSD on TradingView.com
The next key resistance is near $0.5350 or the 50% Fib retracement level of the downward move from the $0.5705 swing high to the $0.4990 low. A close above the $0.5350 resistance zone could spark a strong increase. The next key resistance is near $0.570. If the bulls remain in action above the $0.570 resistance level, there could be a rally toward the $0.620 resistance. Any more gains might send the price toward the $0.680 resistance.
More Losses?
If XRP fails to clear the $0.520 resistance zone, it could start another decline. Initial support on the downside is near the $0.500 level.
The next major support is at $0.490. If there is a downside break and a close below the $0.490 level, the price might accelerate lower. In the stated case, the price could retest the $0.460 support zone.
Technical Indicators
4-Hours MACD – The MACD for XRP/USD is now gaining pace in the bullish zone.
4-Hours RSI (Relative Strength Index) – The RSI for XRP/USD is now near the 50 level.
Major Support Levels – $0.500, $0.4990, and $0.460.
Major Resistance Levels – $0.520, $0.5350, and $0.570.


