Our job as software engineers is most of the time said to be “building” software and systems, but how often are we asked: “Hey how things are going on production?”
Last year, we rebuilt the whole payment system at ManoMano which is, for a marketplace, a very important piece of the business. So, in addition of designing the new system, we also dedicated a significant amount of time to design and implement the observability and the monitoring of our new micro-services. This article aims at sharing how we proceeded, how we iterated over our solutions in order to have something that suits our needs.
Disclaimer
We use Datadog to collect logs and metrics, but also as our alerting tool. I will give the metrics names and monitoring queries we use, but depending on your monitoring stack they can be differentIt’s a REX and obviously some things could NOT be applicable to your own systemThere is always room for improvement, so feel free to comment this article and share what could be interesting to add 🙏
The Target
Like everything we build as engineers, with the team we tried to put in words what would be the ideal monitoring we wanted for our service. Here are some of the key element that emerged:
Should not trigger for false positivesMust cover the technical aspects of the service, but also the functional onesMust be reactive, we want to be alerted as soon as possible that there is a problemWe don’t like mails and prefers alerts to be sent on Slack
This being said, those are pretty standard statement for monitoring services 😅
First decisions were then to send all alerts on dedicated Slack channels and to aim at being able to detect anomalies within 5 minutes.
When a metric goes red
I’m going on an adventure!
To start building our monitoring, we started by writing sentences that describes our services in order to better understand their boundaries, and came up with things like:
It’s a Java/Spring boot application
Running as a pod in a Kubernetes cluster
It provides REST Apis to clients
To perform its tasks, it calls other services using REST Apis
It consumes messages from a Kafka topic
It publishes events in a Kafka topic when updating the domain entity
Then we tried to associate to each sentence, metrics and thresholds that would help knowing if this aspect of the application is healthy.
The metrics
It’s a Java/Spring boot applicationMemory/CPU UsageLiveness probesRunning as a pod in a Kubernetes clusterNumber of pod “READY” should be at least 2 (to ensure high availability)Number of pod is less than 5(according to our workload, having more than 4 pods is a kind of an over scaling for us)The average of restart count per pod is less than 3 (indicates that pods have trouble starting)It provides REST Apis to clients
For each endpoint:
Percentage of 4xx responses is more than 5%Percentage of 5xx responses is more than 3%Response latency is above a given thresholdTo perform its tasks, it calls other services using REST Apis
For each endpoint called:
Percentage of 4xx responses is less than 10%Percentage of 5xx responses is less than 5%Response latency is bellow a given thresholdIt consumes messages from a Kafka topicConsumer lag is less than 10 records (we don’t have huge volumes on the topics we listen to)Dead letter topic publishingIt publishes events in a Kafka topic when updating the domain entityPublication rate in the topic
First iteration: the basis
We discarded the first set of metrics (CPU/Memory/probes), as we agreed that the pod metrics we identified would gives the same information. We implemented the rest of the monitors using the APM metrics and ……. we were a bit flooded by alerts that got auto-resolved within minutes.
It took us few days to adjusts the thresholds to relevant values and here a some of the changes we did:
We switched to P90 latency metric instead of P95 as it was more stable during “quiet” timesWe split the latency monitors for read(GET) and write(POST, PUT, DELETE) endpoints to use more different thresholds for eachWe adjusted the latency thresholds according to the load test campaign we performedWe increased error thresholds to 10% for 4xx and 5% for 5xx response codes on our endpoints.In our rest clients metrics, we excluded 404 response codes as generally it is legit for some resources to not exist.
After tweaking the monitors, we managed to get rid of most of false positive alerts and were able to detect few production incidents within minutes 💪
But we also missed some 😅
As our monitoring was mainly focusing on the technical aspects of our services (the adapters as the are defined in the hexagonal architecture) we were completely blind if a functional behaviour was wrong but the system was still processing requests.
Second iteration: let’s get functional
Before going further I will need to explain what purposes our services serve. They support the purchasing funnel, allowing customers to initiate payments, choosing a payment method, communicating with our PSPs in a synchronous flow. But they also receive webhooks from the PSPs in order to deal with the the confirmation or failures of payments, this is the asynchronous flow.
In order to better monitor our services, we identified scenarii where the “technical” monitors would stay green but the system would be broken. We came up with this kind of possibilities:
Customers can create new payments, but all payments are failed through the async flowCustomers can’t create new payments, but we are still receiving confirmation through the webhooks
In the end we saw that most of our blind spots come from the way our system works with both a synchronous and an asynchronous flows and, instead of focussing on our adapters, we needed to be able to follow the business events occurring.
We started to think about how to be able to track them and came up with the decision to publish a metric when our business entities statuses were changing(which is what triggers our business events), containing relevant tags (occurrence date, type of event, customer country an few more). Publishing metrics with tags is quite straight forward with Spring Boot, so we implemented many of those 🙌
Example of event types on the payment entity:created: the payment is initiatedconfirmed: the PSP responded with a successfailed: the response from the PSP indicated that the payment failedBusiness events
Once implemented, we gain a very deep understanding regarding what the system was doing. We were then able to monitor things with more complexity, implementing checks like:
There must be payment creation creation occurring within the last X minutesThere must be payment confirmation occurring within the last X minutesThe ratio payment created over payment confirmed must not go bellow a threshold. This one helped us identifying slowness in our Kafka cluster because of massive publishing
Small tips we learnt
Thresholds are complicated to tweak, this is why we opted for ratios in some of our monitors. Their values is usually steadier and more reliableTo avoid fragile monitors, make sure the metrics used have enough values during the timeframe of the calculation. The less there is values available, the more you will have false positiveIncreasing the timeframe of monitors calculation makes them more robust but less reactiveTo avoid having the alert channel full in the morning (because usually there is ve little traffic during the night), we decided to “mute” some of the monitors during the night with automatic schedulingAs a safety measure, we added monitors on logs in ERROR level, this forced us to review them and eliminate their root causeSometimes thresholds are not the best choice of trigger. Datadog provides an anomaly monitor that computes past values of a metric in order to detect if a metric is not behaving like it used to
Farewell and thanks for listening
Our journey to build our alerting was not an easy one, it took us time and errors to come up with something that we were comfortable with. We are now trustfully relying on it and it has become one of our key strengths to keep the system up and make sure the paying experience stays flawless.
For those interested, here are some of the metrics and queries we use
There is at least 1 available pod: avg(last_5m):sum:kubernetes_state.deployment.replicas_available{env:prd,kube_deployment:service-name} <= 1There no more than 4 pods: avg(last_5m):sum:kubernetes_state.deployment.replicas_available{env:prd,kube_deployment:service-name} ≥ 4pod restars: avg(last_5m):sum:kubernetes.containers.restarts{env:prd,kube_deployment:my-service, kuber_container_name: main} > 4Ratio of 4xx responses: sum(last_5m): (sum:trace.servlet.request.hits.by_http_status{env:prd,service:my-service,http.status_class:4xx}.as_count() / sum:trace.servlet.request.hits{env:prd,service:my-service}.as_count()) * 100 > 10Ratio of 5xx responses: sum(last_5m): (sum:trace.servlet.request.hits.by_http_status{env:prd,service:my-service,http.status_class:5xx}.as_count() / sum:trace.servlet.request.hits{env:prd,service:my-service}.as_count()) * 100 > 5Latency on write endpoints: percentile(last_5m):p90:trace.servlet.request{service:my-service
AND (resource_name:delete_* OR resource_name:put_* OR resource_name:post_*)
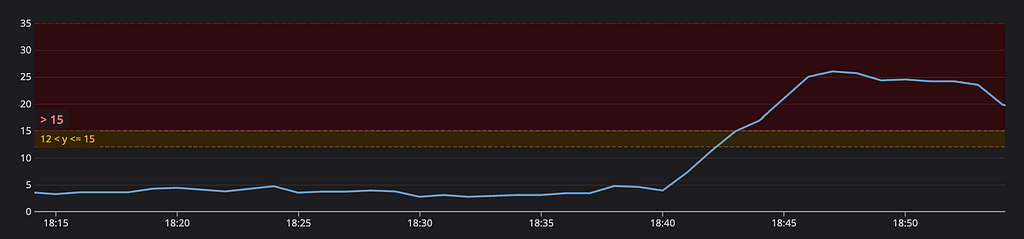
AND env:prd} > 1Consumer lag for a group: avg(last_5m):aws.kafka.max_offset_lag{consumer_group:my-consumer-group, env:prd} > 15
Monitoring guide through operations: how we designed the monitoring of our payment system was originally published in ManoMano Tech team on Medium, where people are continuing the conversation by highlighting and responding to this story.