
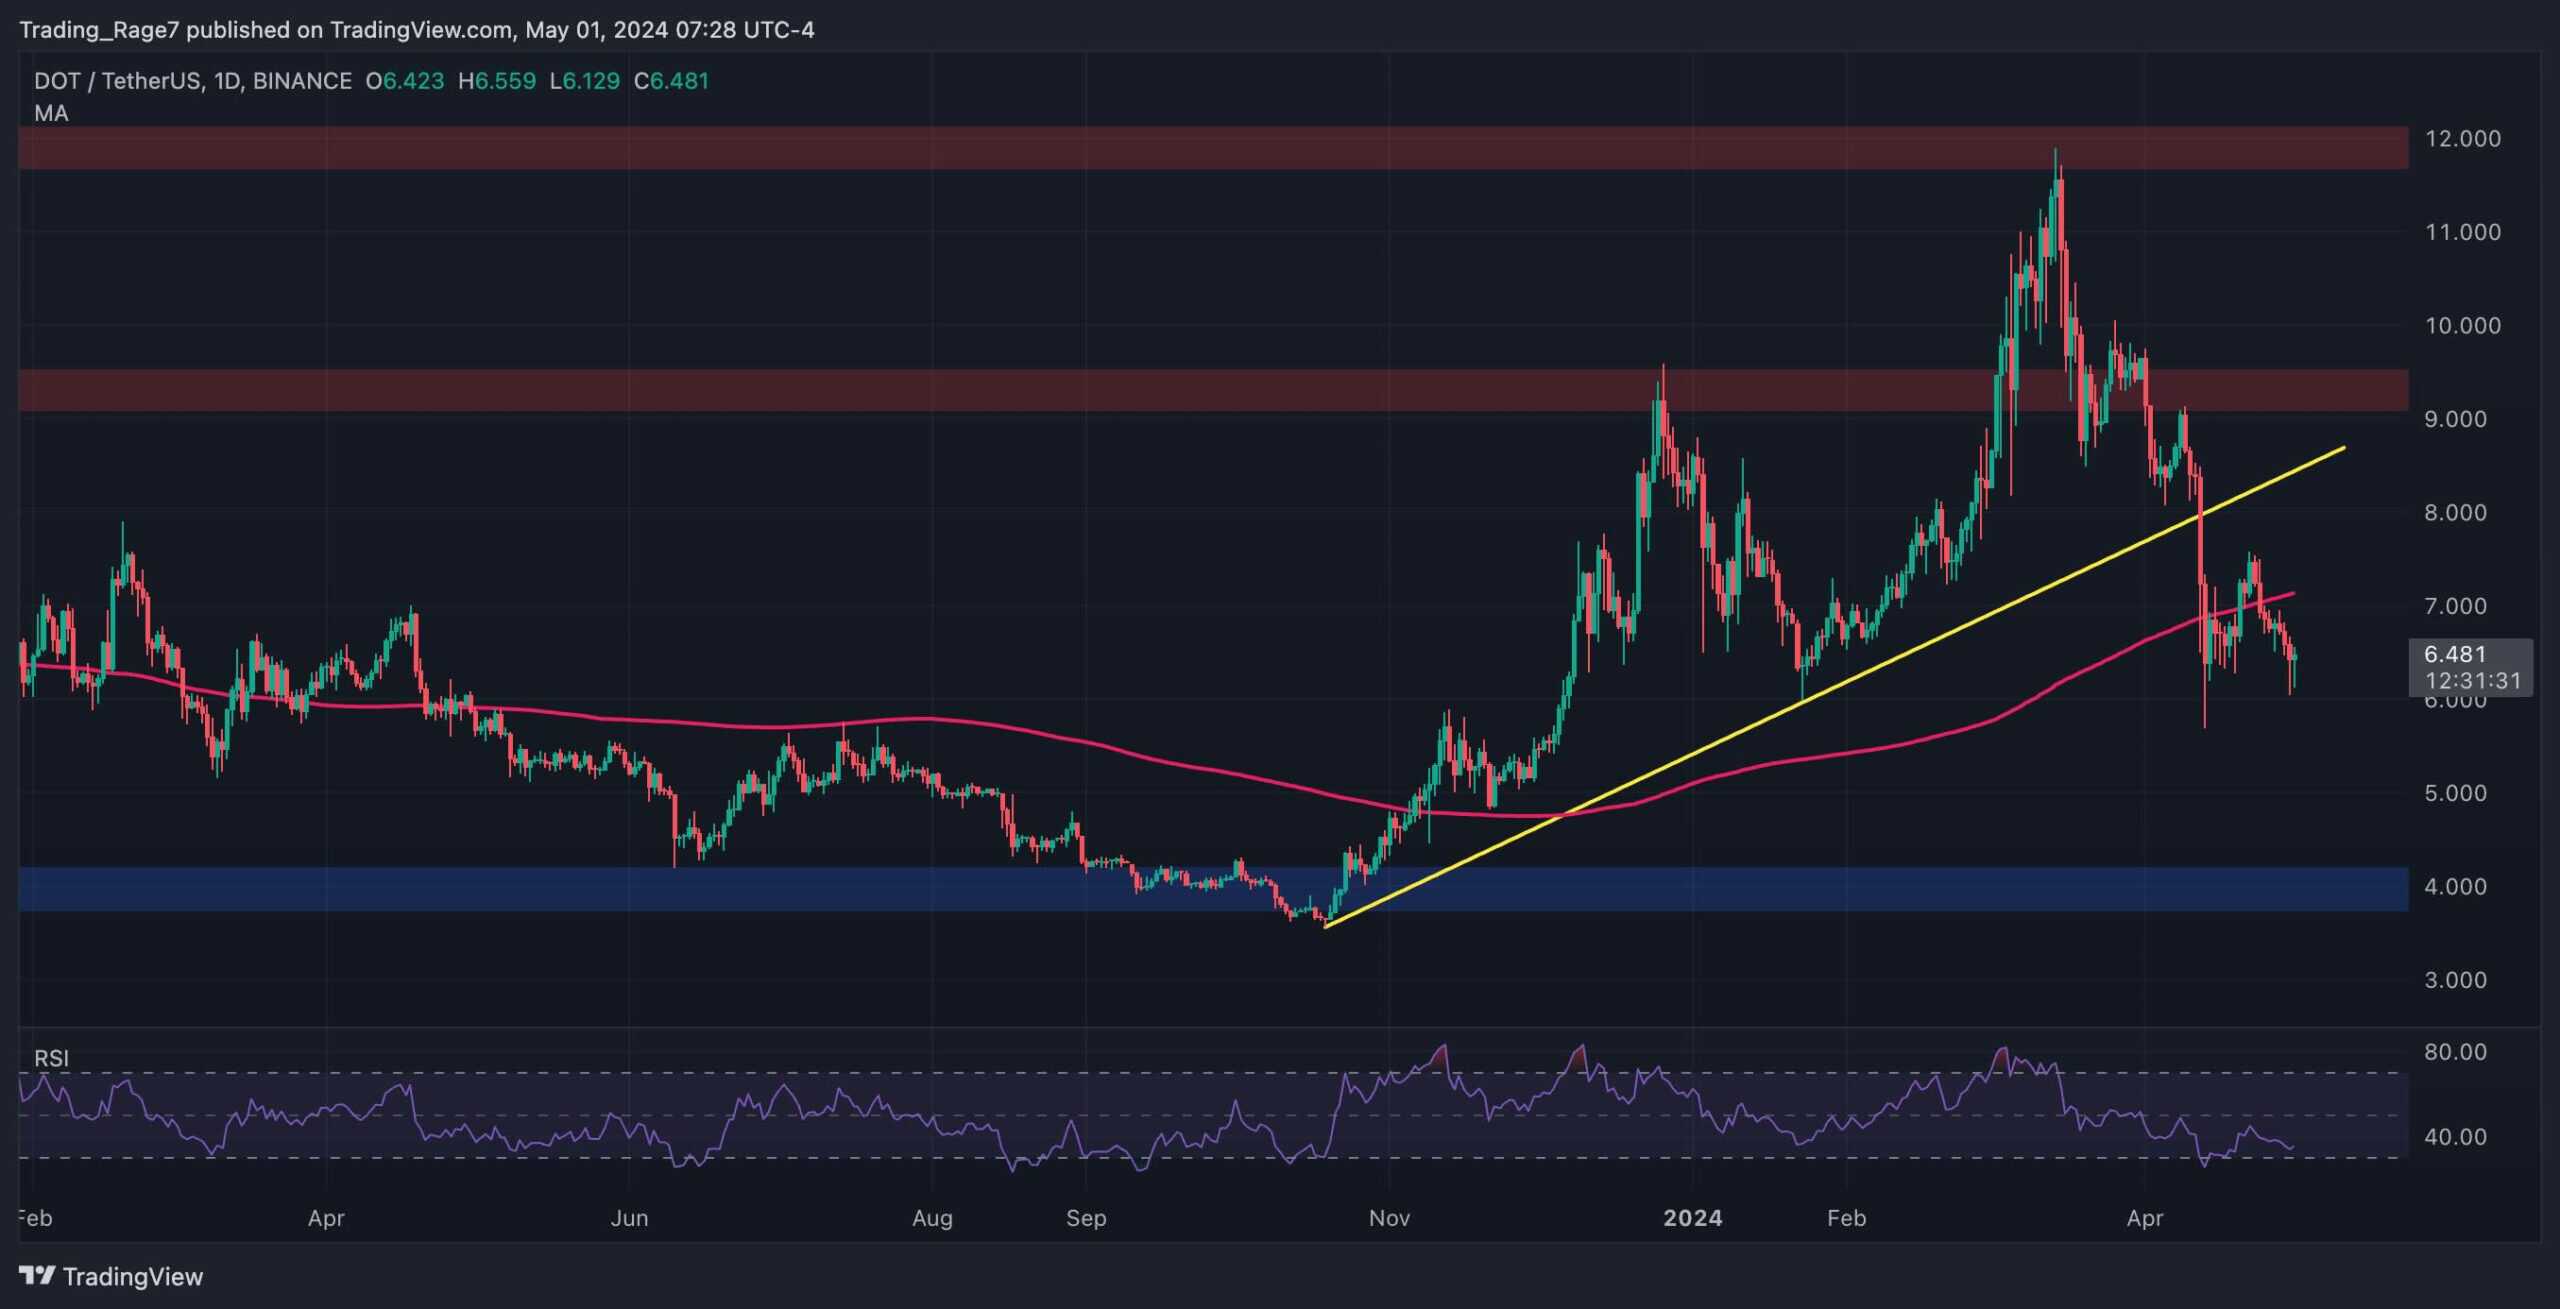
Polkadot’s price is primed for a potential bullish rebound in the medium term, as it has reached a significant and decisive support zone, including the range between the 0.5 and 0.618 Fibonacci retracement levels, as well as the dynamic support provided by the 100-day moving average.
Technical Analysis
By Shayan
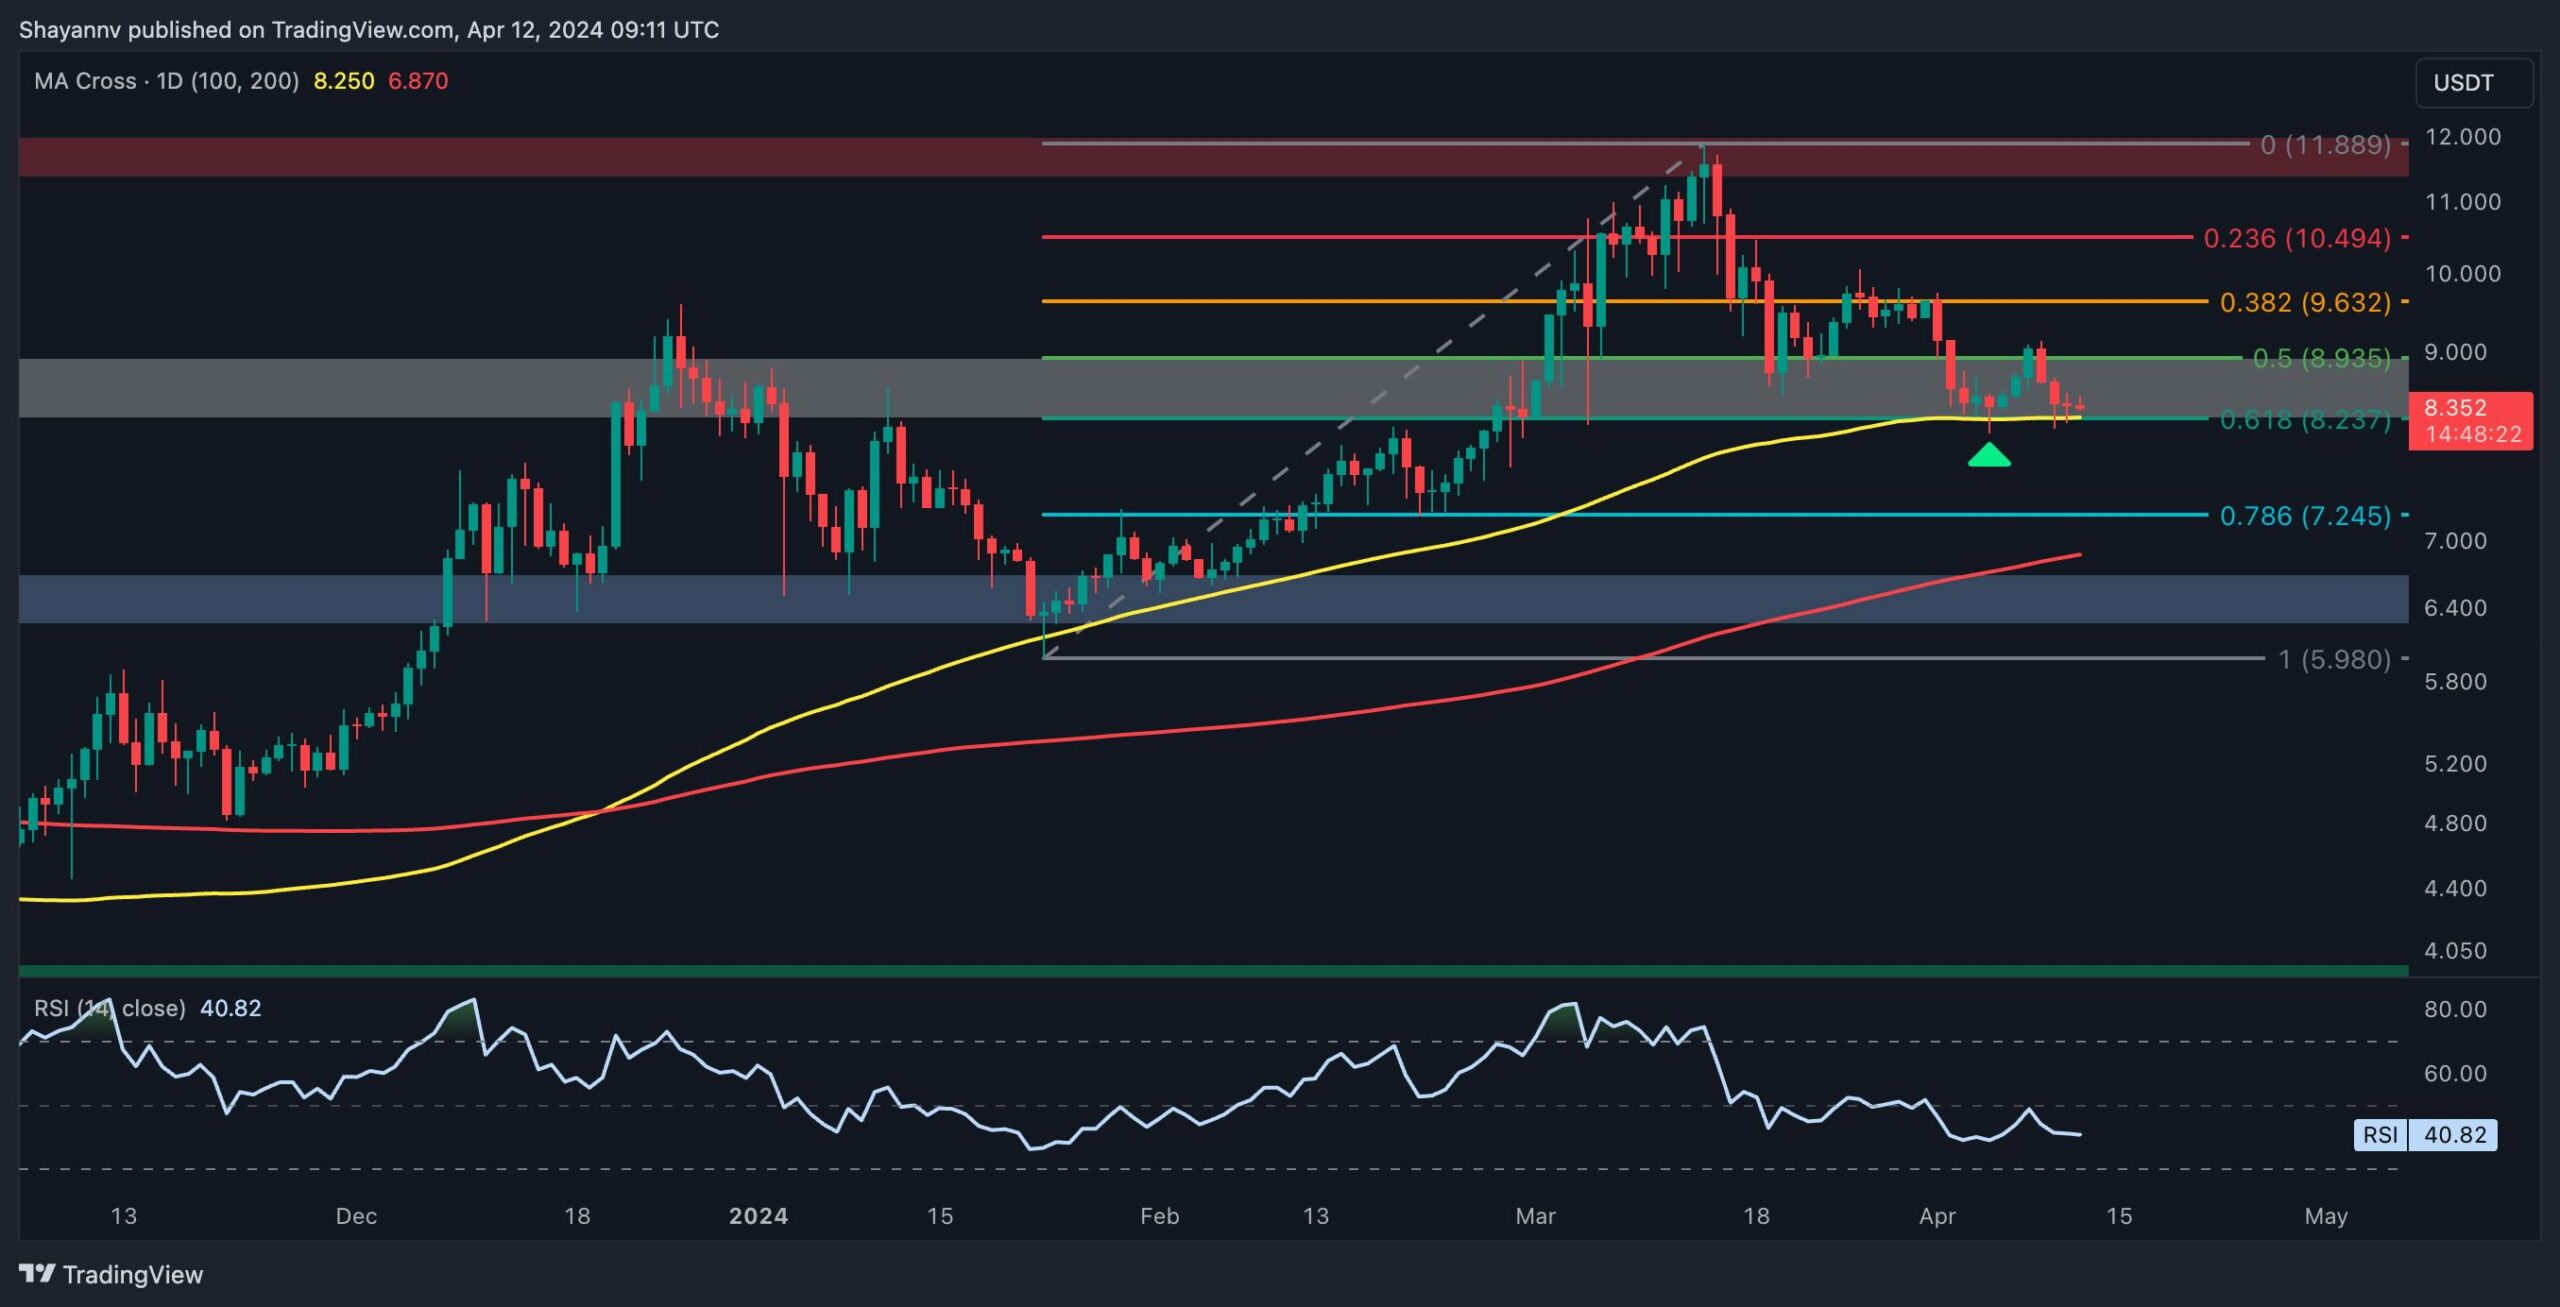
The Daily Chart
A detailed examination of the daily chart reveals a substantial downward retracement, with Polkadot experiencing a 30% decline from its yearly high of $11.9. However, sellers have encountered a formidable obstacle in the form of the dynamic support offered by the 100-day moving average, which aligns closely with the critical Fibonacci retracement levels.
This crucial support region is anticipated to prevent further downward pressure, with the market likely to witness a notable rebound in the medium term. The presence of significant demand near this pivotal area is expected to drive heightened buying activity, leading to a renewed surge toward the pivotal $10 threshold in the medium term.
However, it’s important to acknowledge that a sudden decline below this critical support zone could trigger a cascade of long liquidations, potentially leading to a significant drop towards the $7.2 mark.
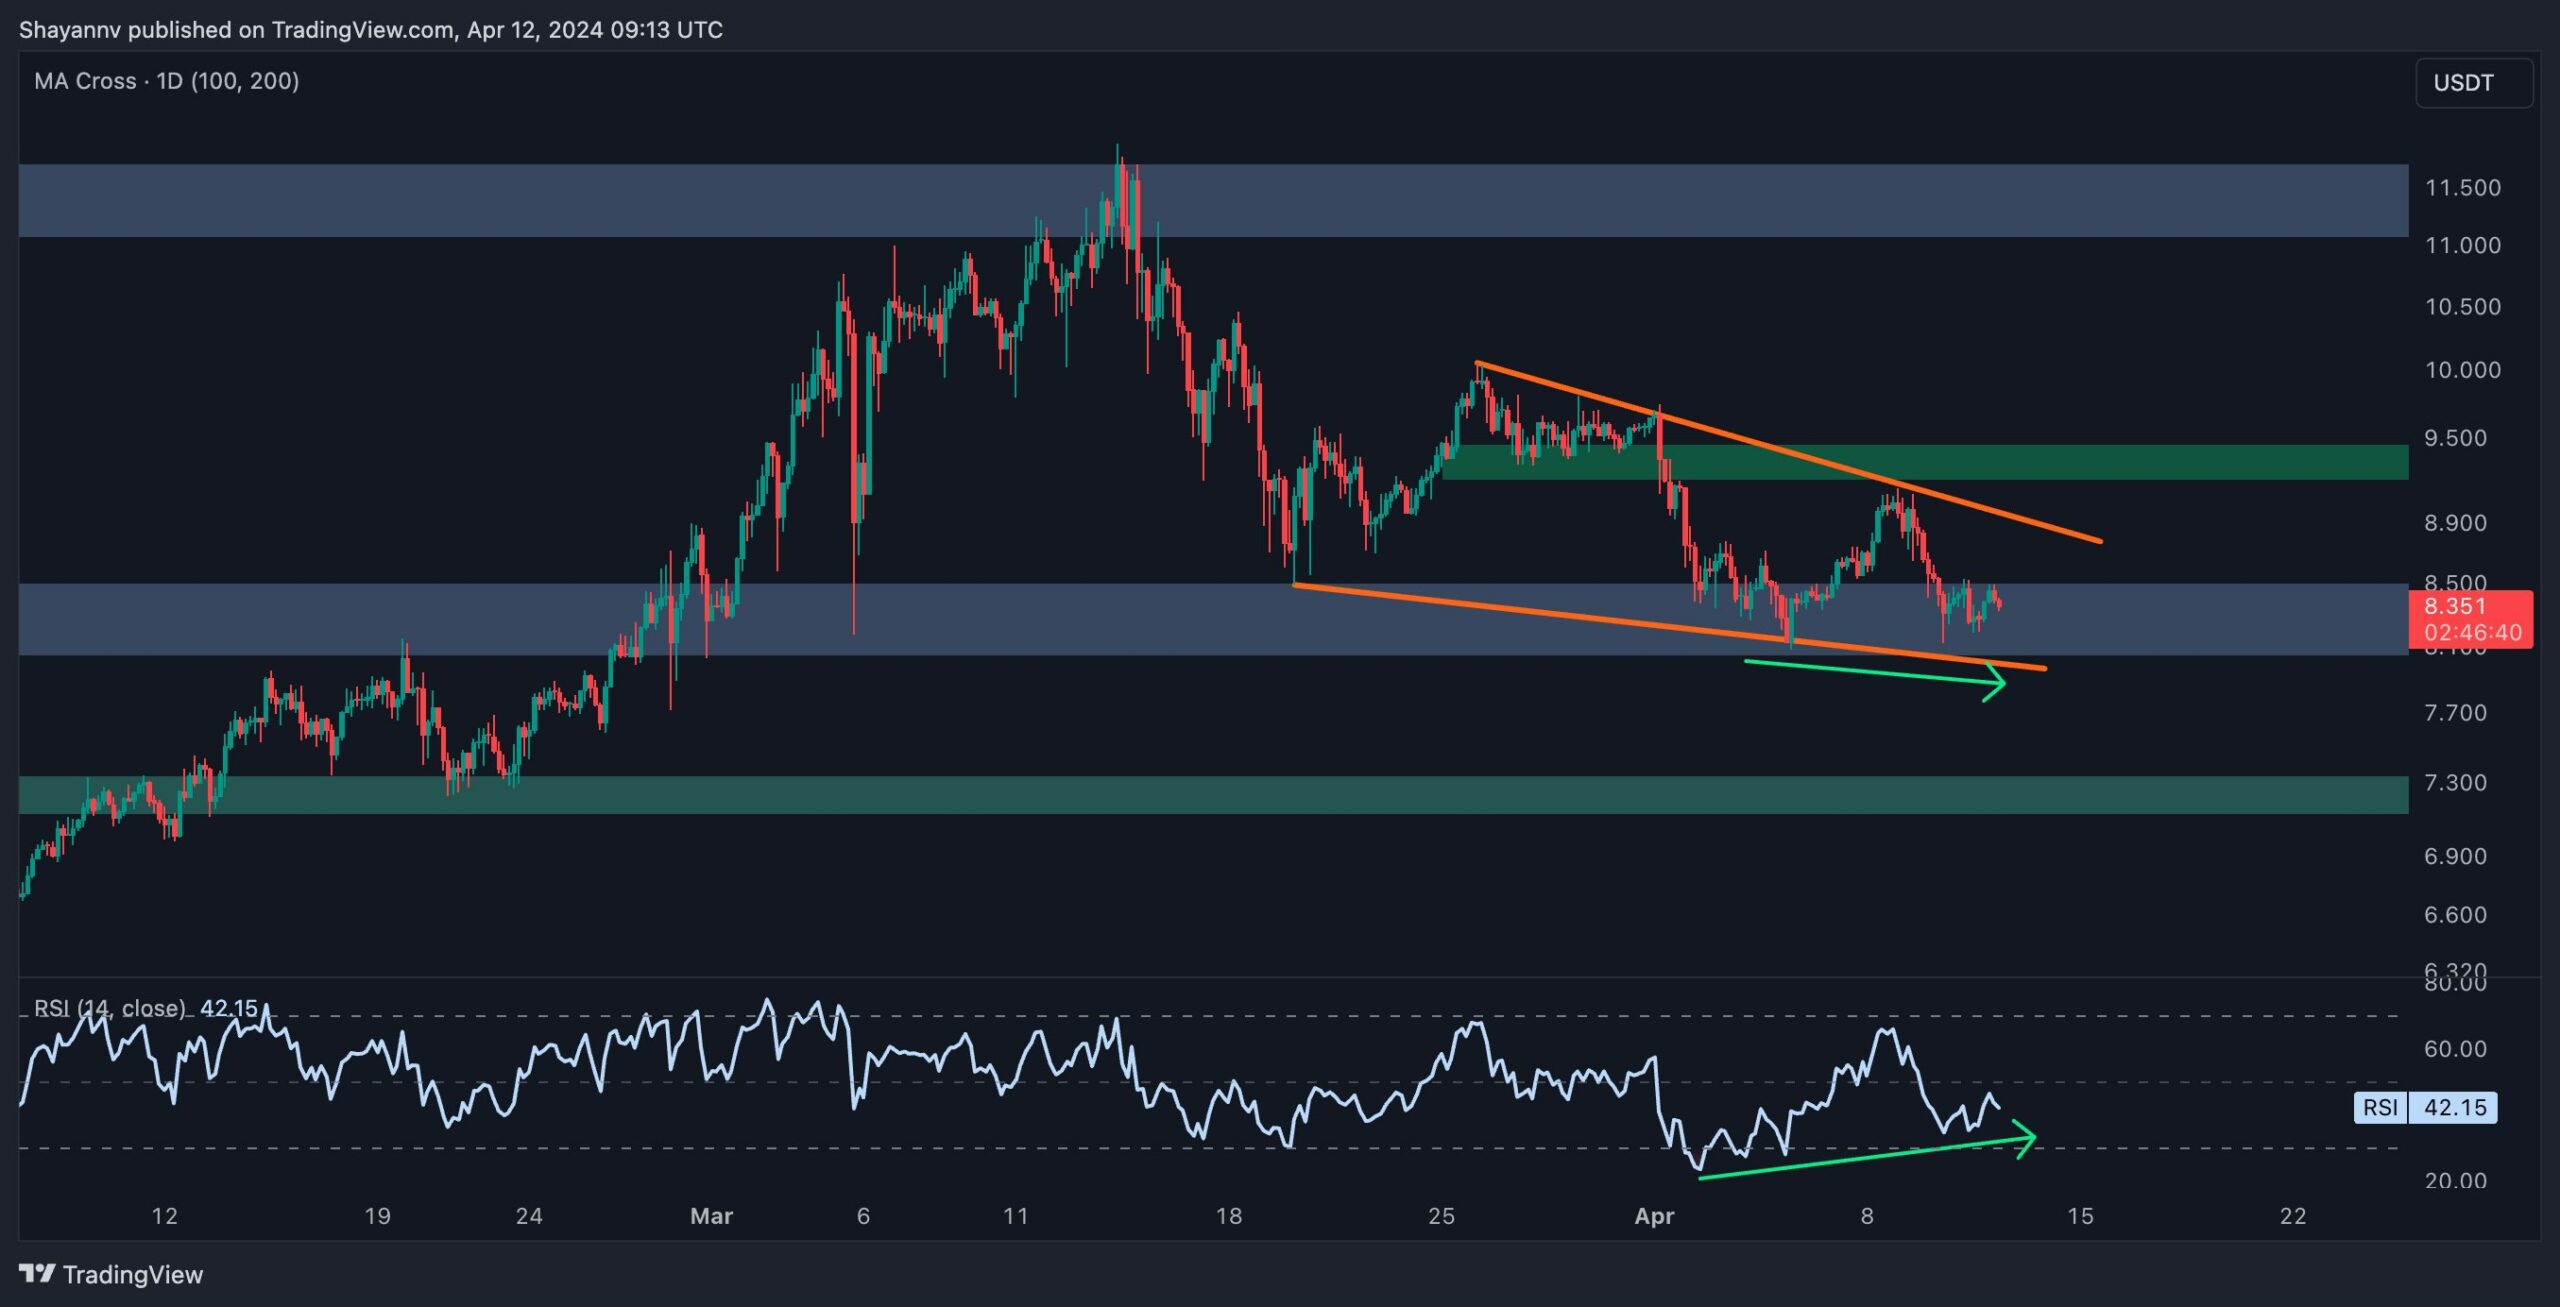
The 4-Hour Chart
A comprehensive analysis of the 4-hour timeframe indicates that Polkadot’s price has recently found support around the crucial $8 level, prompting a period of slight sideways consolidation.
This crucial support zone aligns harmoniously with the lower boundary of a descending wedge pattern, acting as a robust barrier against further downward movement.
Furthermore, a minor bullish divergence has emerged between the RSI indicator and Polkadot’s price, signaling the potential for a bullish revival in the medium term and reigniting market demand.
Consequently, it seems likely that Polkadot’s price will continue to fluctuate within this critical wedge pattern and near the significant $8 support zone until a breakout occurs. Nevertheless, the prevailing sentiment in the market appears bullish, fostering expectations of a renewed upward movement towards the $10 threshold in the medium term.
Sentiment Analysis
By Shayan
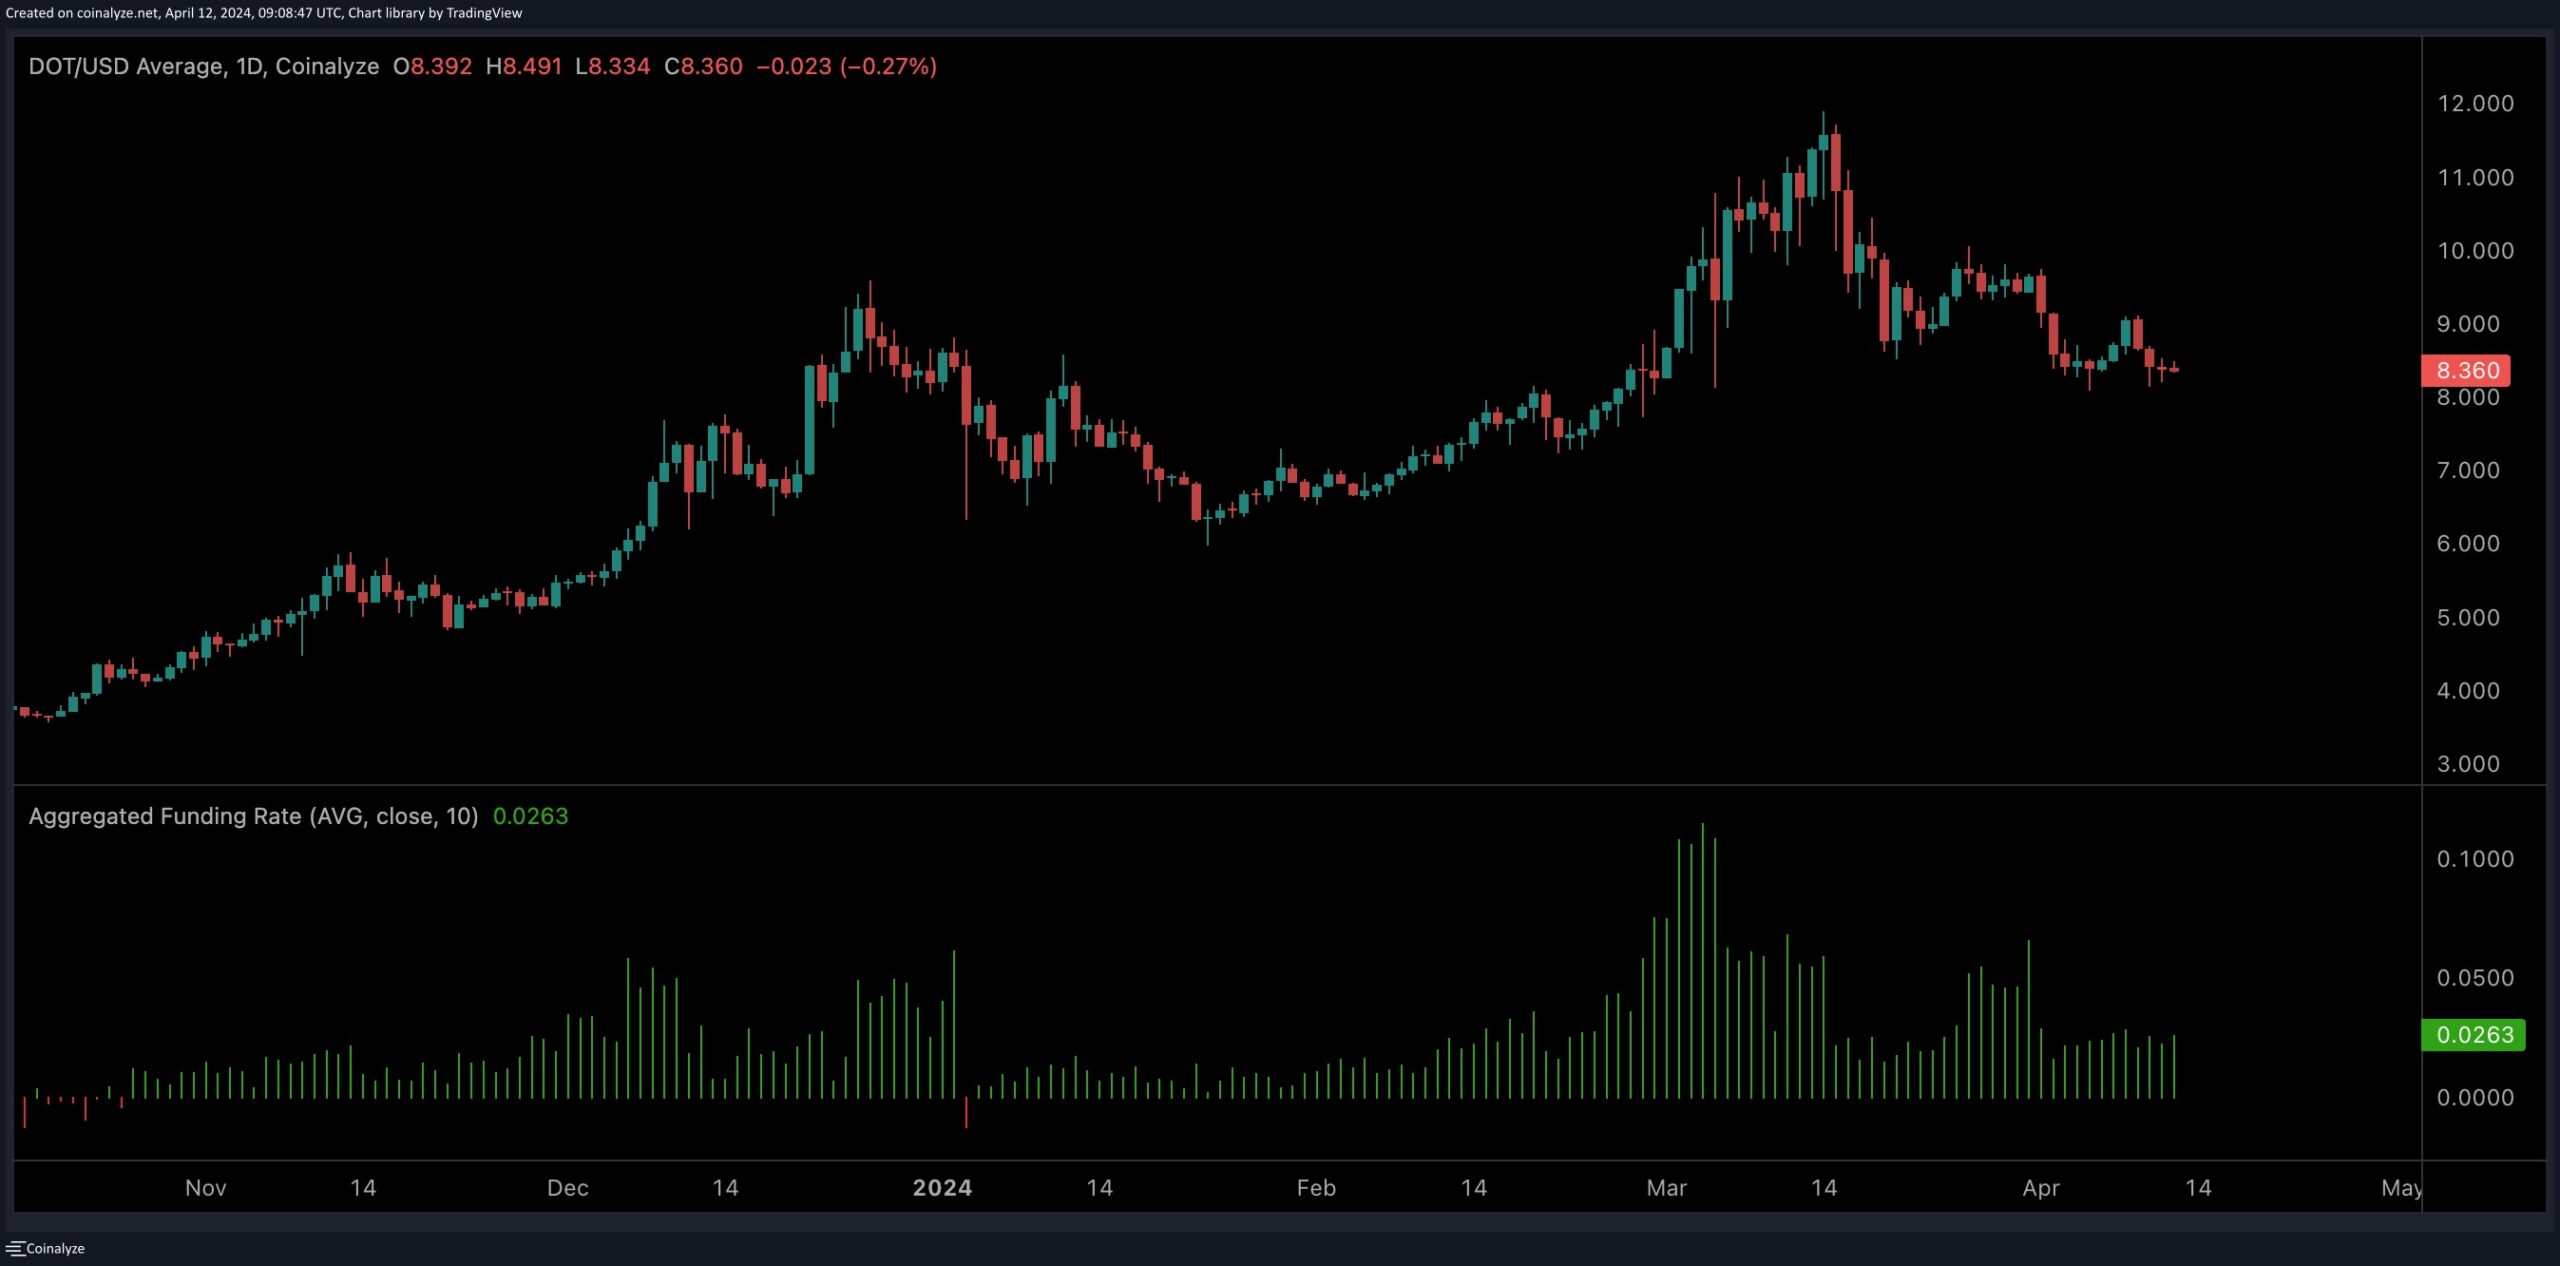
DOT’s price has undergone a prolonged period of significant corrections, witnessing a 30% decline from its yearly peak of $11.9. Assessing whether this correction has dampened activity in the futures market holds significance for investors.
Presented below is a chart illustrating Polkadot’s aggregate funding rates, which serve as indicators of the intensity with which buyers or sellers are executing their orders. Elevated funding rates often precede a cascade of long liquidations. Thus, while positive funding rates are essential, excessively high values raise concerns.
The chart reveals a recent slight decline in price, accompanied by a continuous drop in funding rates following a notable spike. This suggests a cooling down of the futures market. However, it’s noteworthy that despite this decline, the metric still reflects positive values. Moreover, the futures market appears poised for the re-establishment of long positions.
In light of these observations, this trend can be interpreted as a positive sign, as it reduces the likelihood of further liquidations and sets the stage for a sustainable uptrend in the medium term.
This post is powered by Polkadot.
The post Polkadot Price Analysis: DOT Reaches a Significant Decision Point as Bears Unable to Break Below $8 appeared first on CryptoPotato.


