
After a period of subdued consolidation near the crucial $6 support region, Polkadot’s price encountered significant buying pressure, initiating a notable upward swing.
As a result, the crucial 0.5 Fibonacci level ($8.8) appears to be Polkadot’s next mid-term target.
Polkadot Price Analysis: Technicals
By Shayan
The Daily Chart
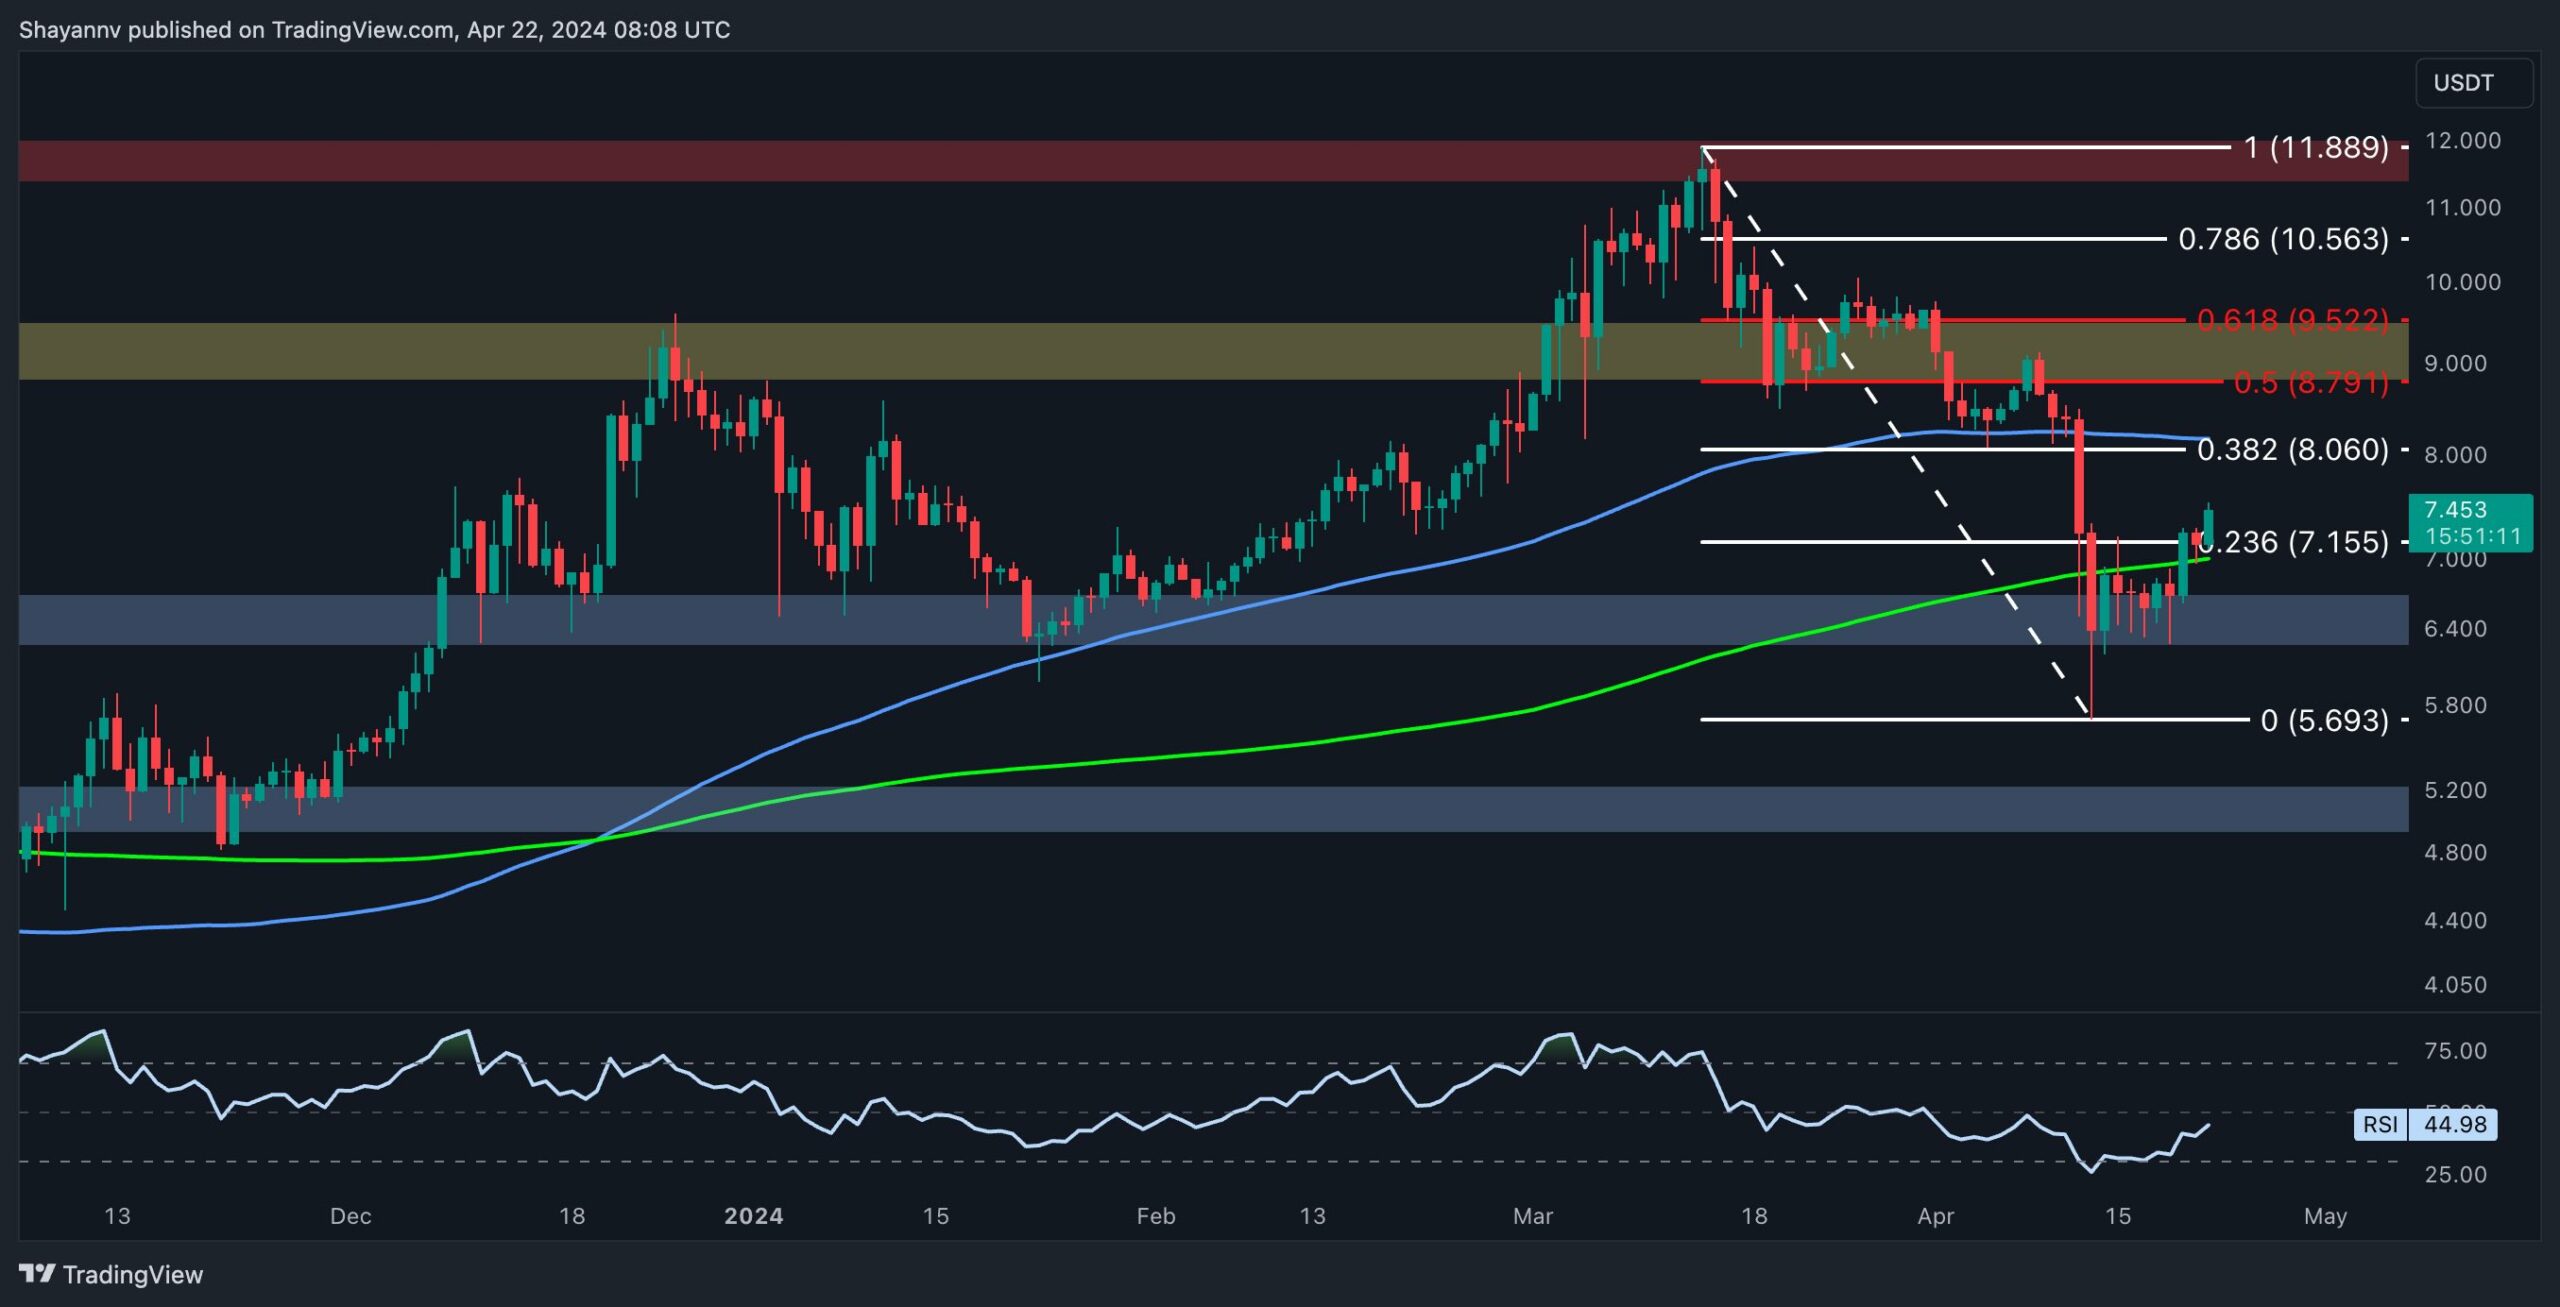
As part of our comprehensive Polkadot price analysis, we examined the notable recent changes in the market behavior. A closer look at the daily chart reveals that after consolidation around the significant support level of $6, buyers gained control, sparking a notable bullish rebound. This resurgence propelled the DOT price to reclaim the previously breached 200-day moving average at $7, signaling a bullish outlook for its long-term trajectory.
However, significant resistance lies ahead, including the 100-day moving average at $8.1 and the 0.5 Fibonacci retracement level ($8.8). These marks, in conjunction with the critical support provided by the 200-day MA, currently serve as key reference points for Polkadot in the short term and can potentially influence market trends in the coming weeks.
The 4-Hour Chart
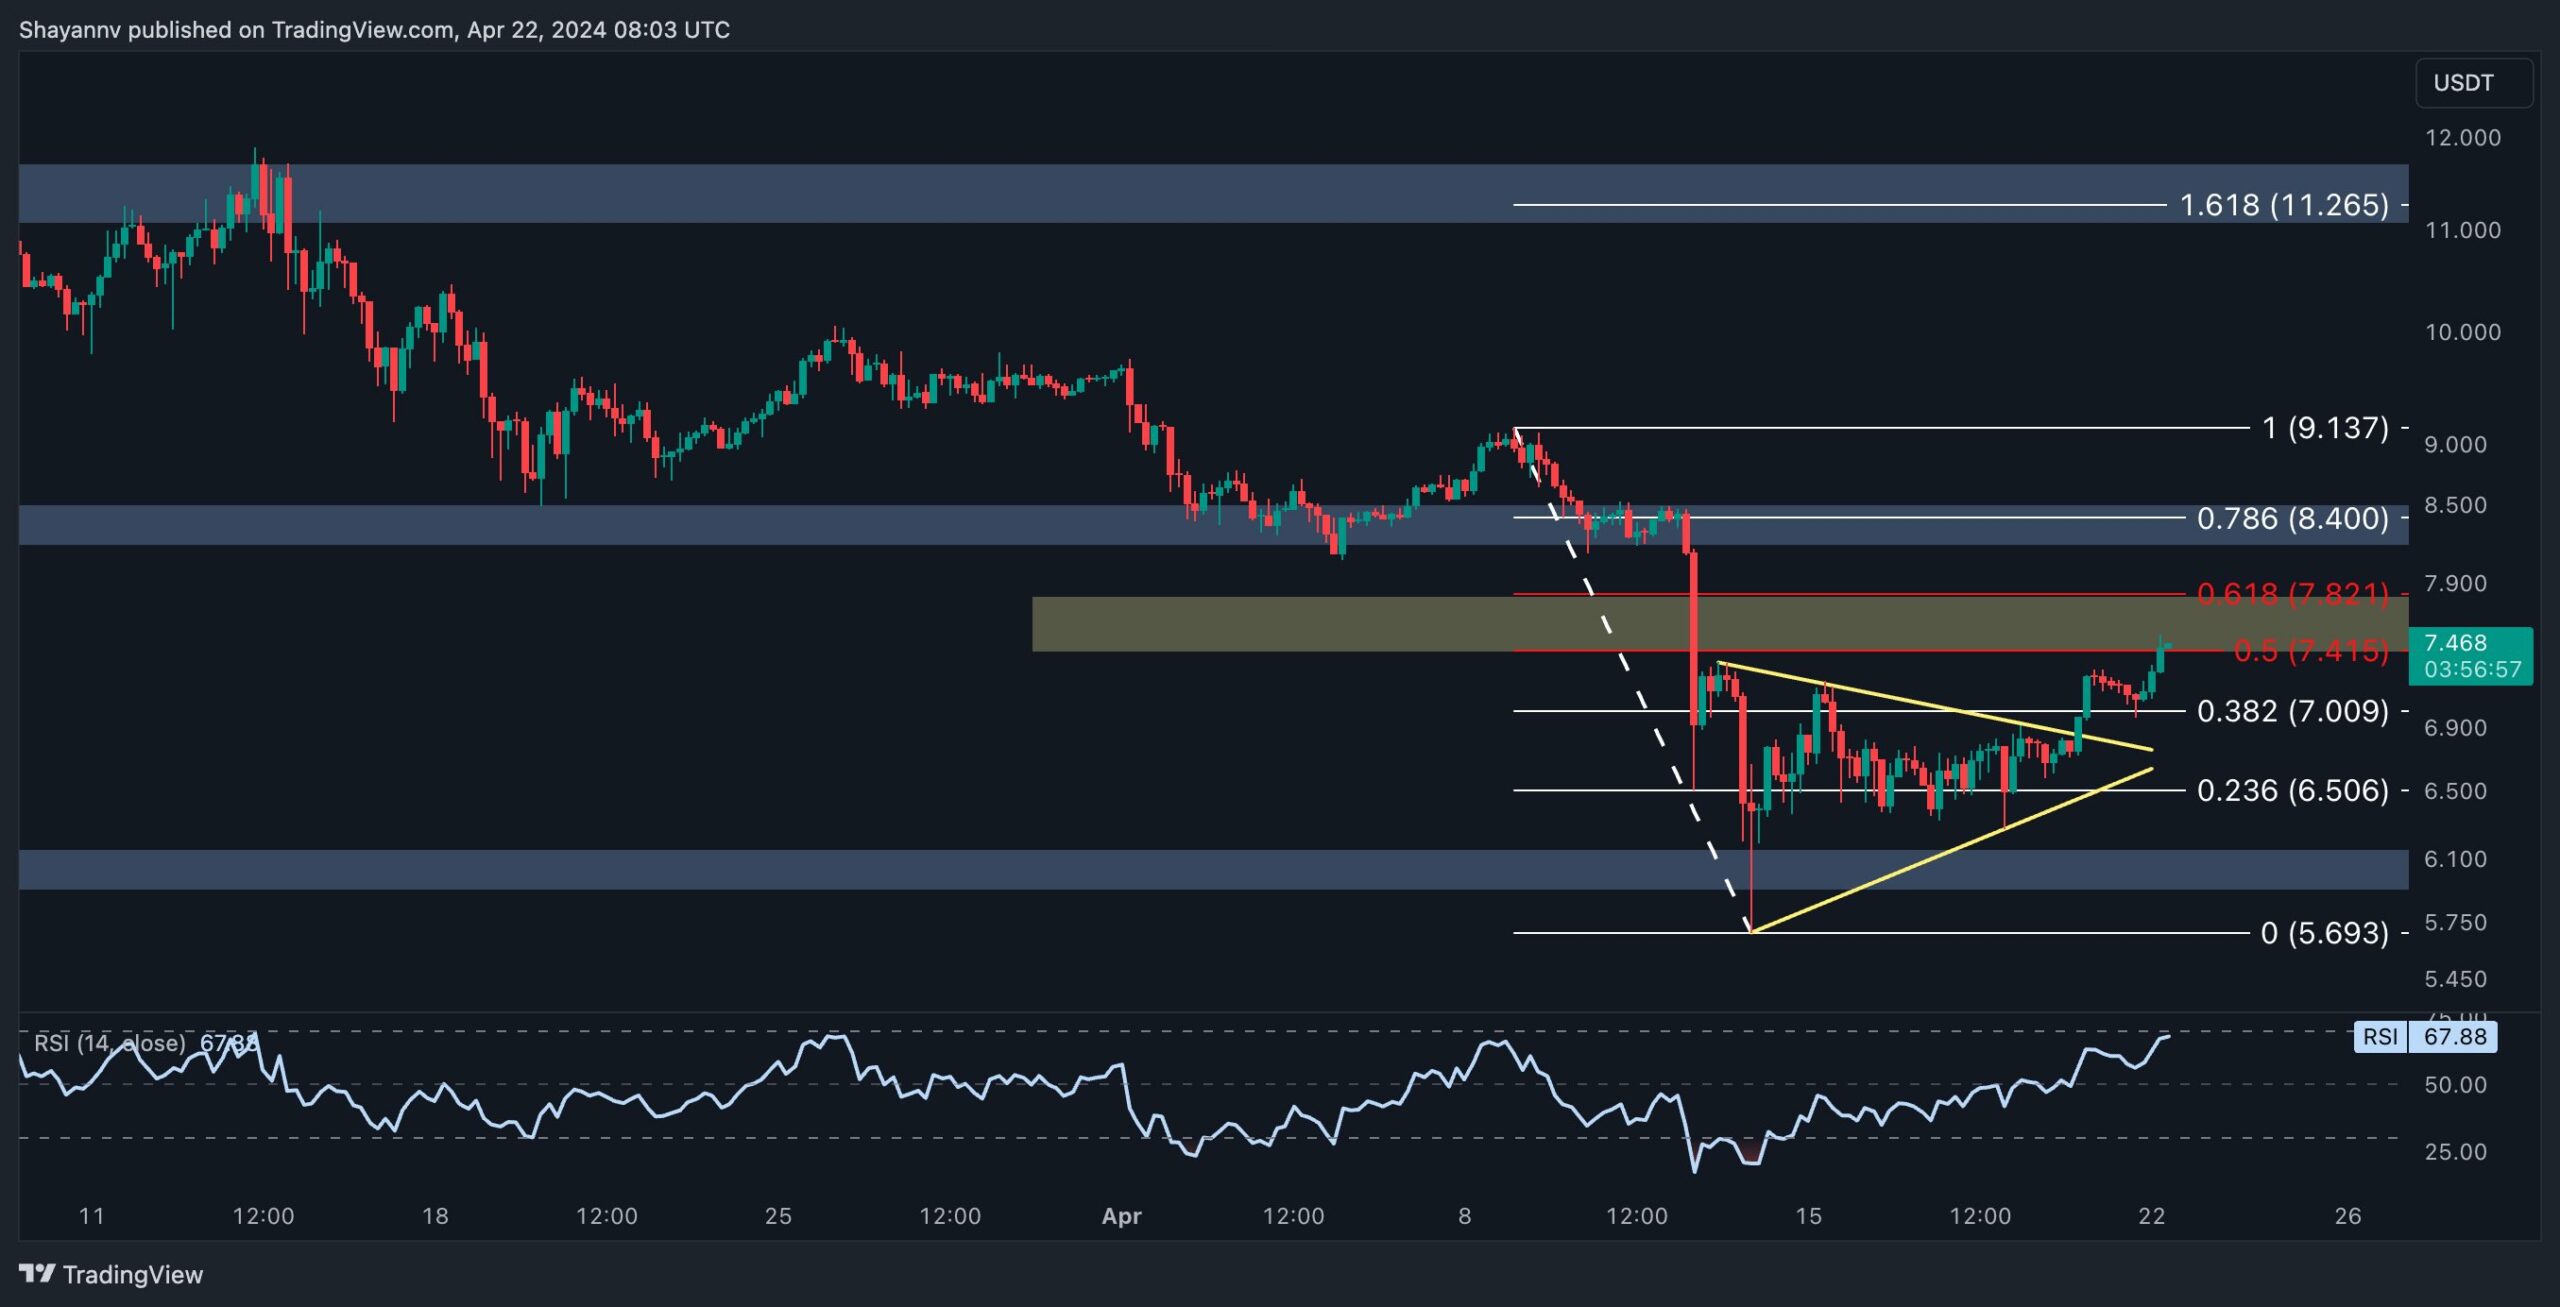
A detailed examination of the 4-hour timeframe reveals the formation of a sideways triangle pattern following a period of indecisive consolidation near the crucial $6 mark. Nevertheless, the price successfully broke above the upper boundary of the triangle, indicating the dominance of buyers in this region and sustaining upward momentum.
Currently, the Polkadot price has entered a crucial and decisive range defined by the 0.5 ($7.4) and 0.618 ($7.8) Fibonacci levels, where a significant amount of supply may be present.
Therefore, what happens near this critical juncture is significant, as it could determine DOT’s future direction. A break above this crucial region would likely lead to the continuation of the current uptrend toward the critical resistance level at $8.8.
Sentiment Analysis
By Shayan
The perpetual futures market plays a pivotal role in shaping cryptocurrency prices, with the establishment of long or short positions often resulting in increased market volatility and rapid price fluctuations. Therefore, analyzing its sentiment and the level of aggressiveness in these positions can provide valuable insights for traders and investors alike.
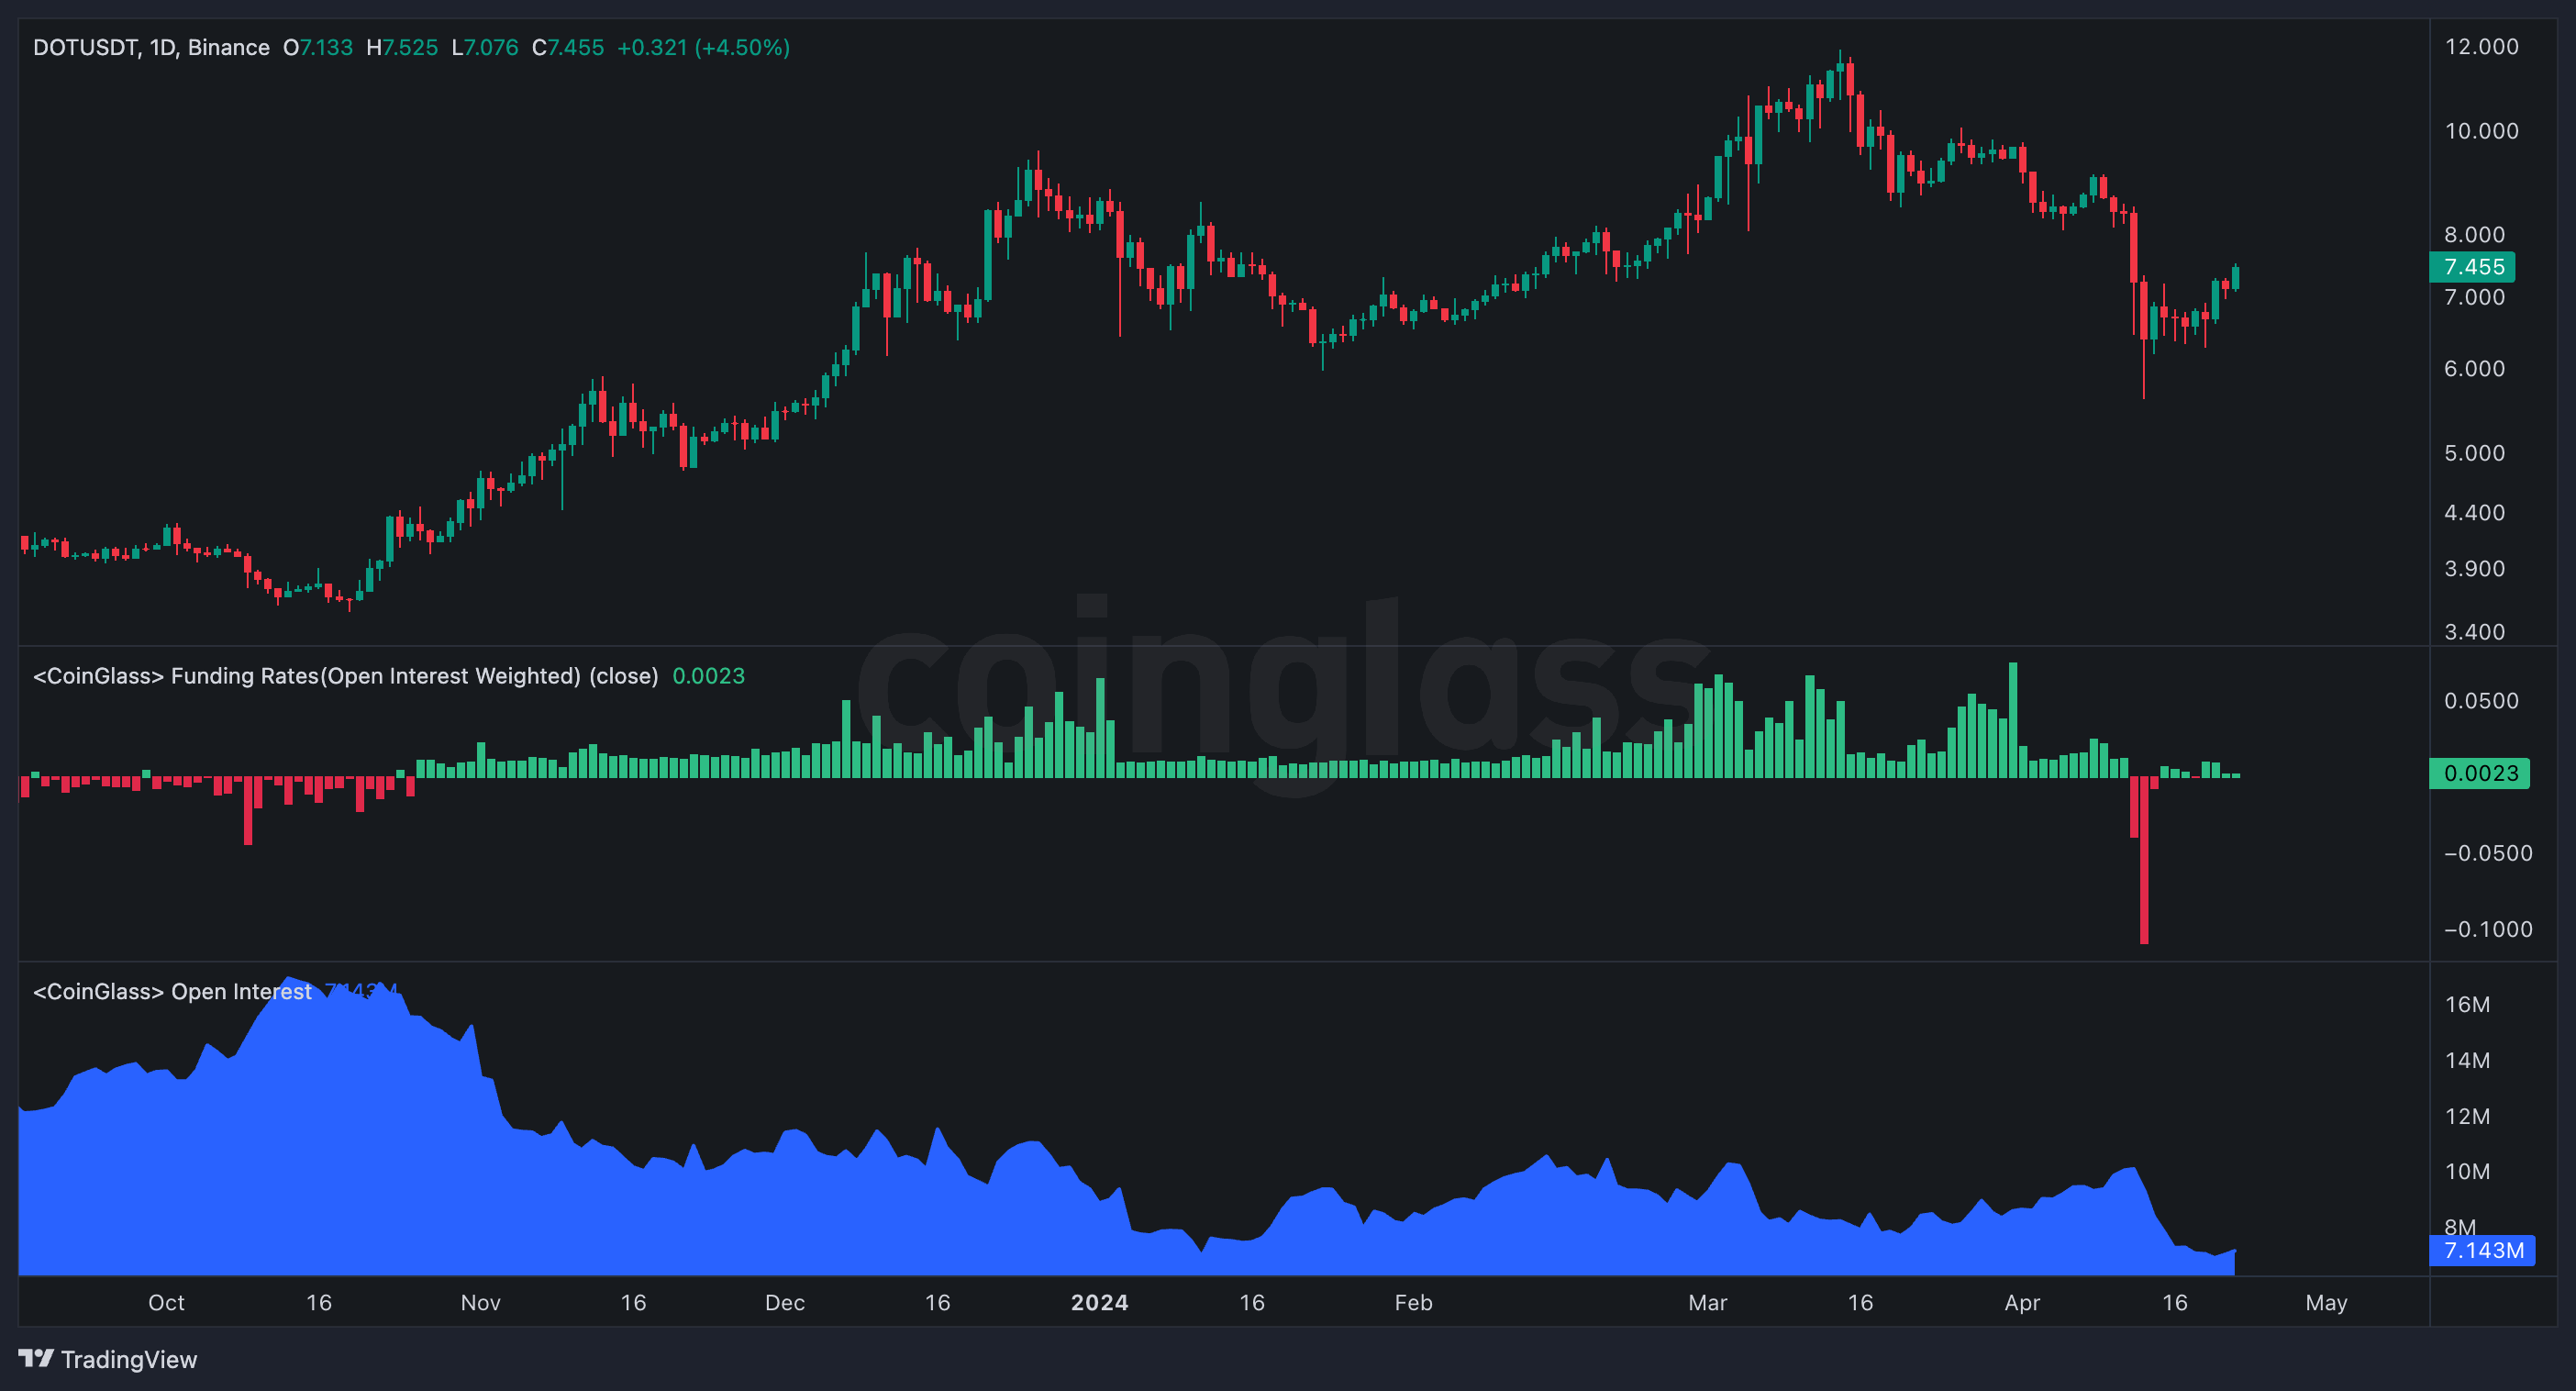
The accompanying chart visually represents the Funding Rates and Open Interest metrics alongside Polkadot’s price movements. It is evident from the chart that following a significant decline in DOT’s value; there has been a corresponding decrease in both metrics.
This suggests that not only has the futures market cooled down, with a substantial number of positions being liquidated, but it has also shifted to a neutral stance, as indicated by the near-zero values in the funding rate metric.
This confluence of factors indicates that the market is poised for renewed activity, with the potential for re-establishing long and short positions. Consequently, Polkadot is anticipated to experience heightened volatility in the mid-term, potentially leading to significant price movements.
This post has been powered by Polkadot
The post Polkadot Price Analysis: DOT Soars 4% Daily as Traders Brace for Incoming Volatility appeared first on CryptoPotato.


