
With the FED interest rate decision expected today, the market turned bearish, and Bitcoin crashed by over 5% within a few hours. Let’s examine three different technical indicators that may provide important insights into why the market is currently making new local lows.
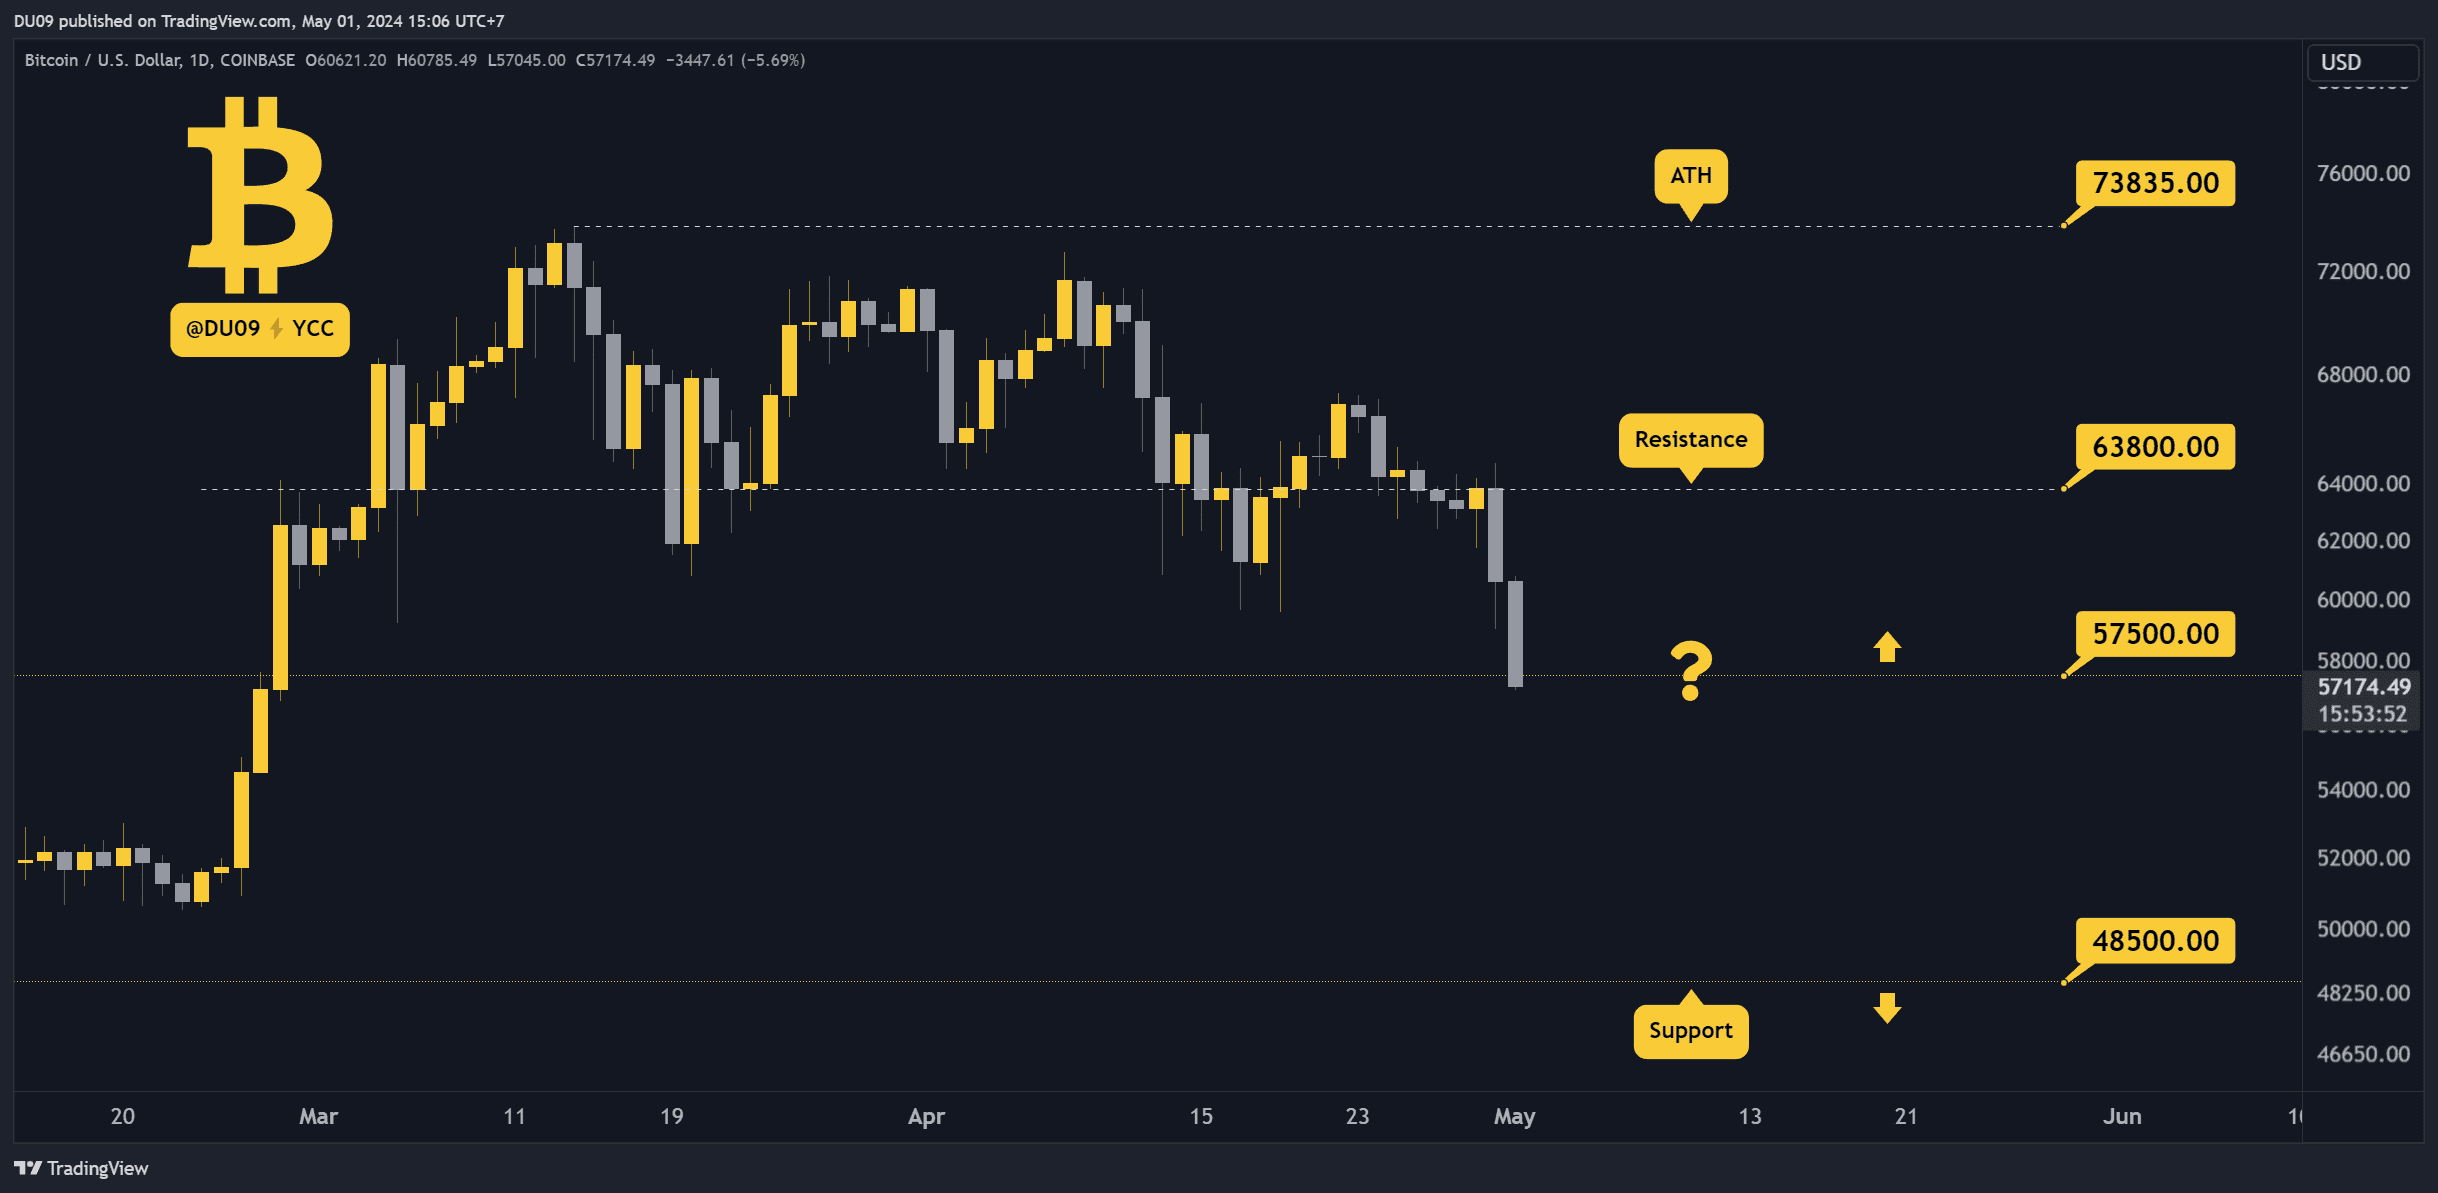
Key Support levels: $52,000, $48,500
Key Resistance levels: $57,500, $63,800
1. BTC Price Breaks Key Support
Since April, Bitcoin has been making lower lows, which confirms a bearish trend, at least in a short to medium timeframe. Unfortunately, this did not change in May, as the month started with a new low. BTC just dropped under $57K, and in the process, it broke the support at $58K.
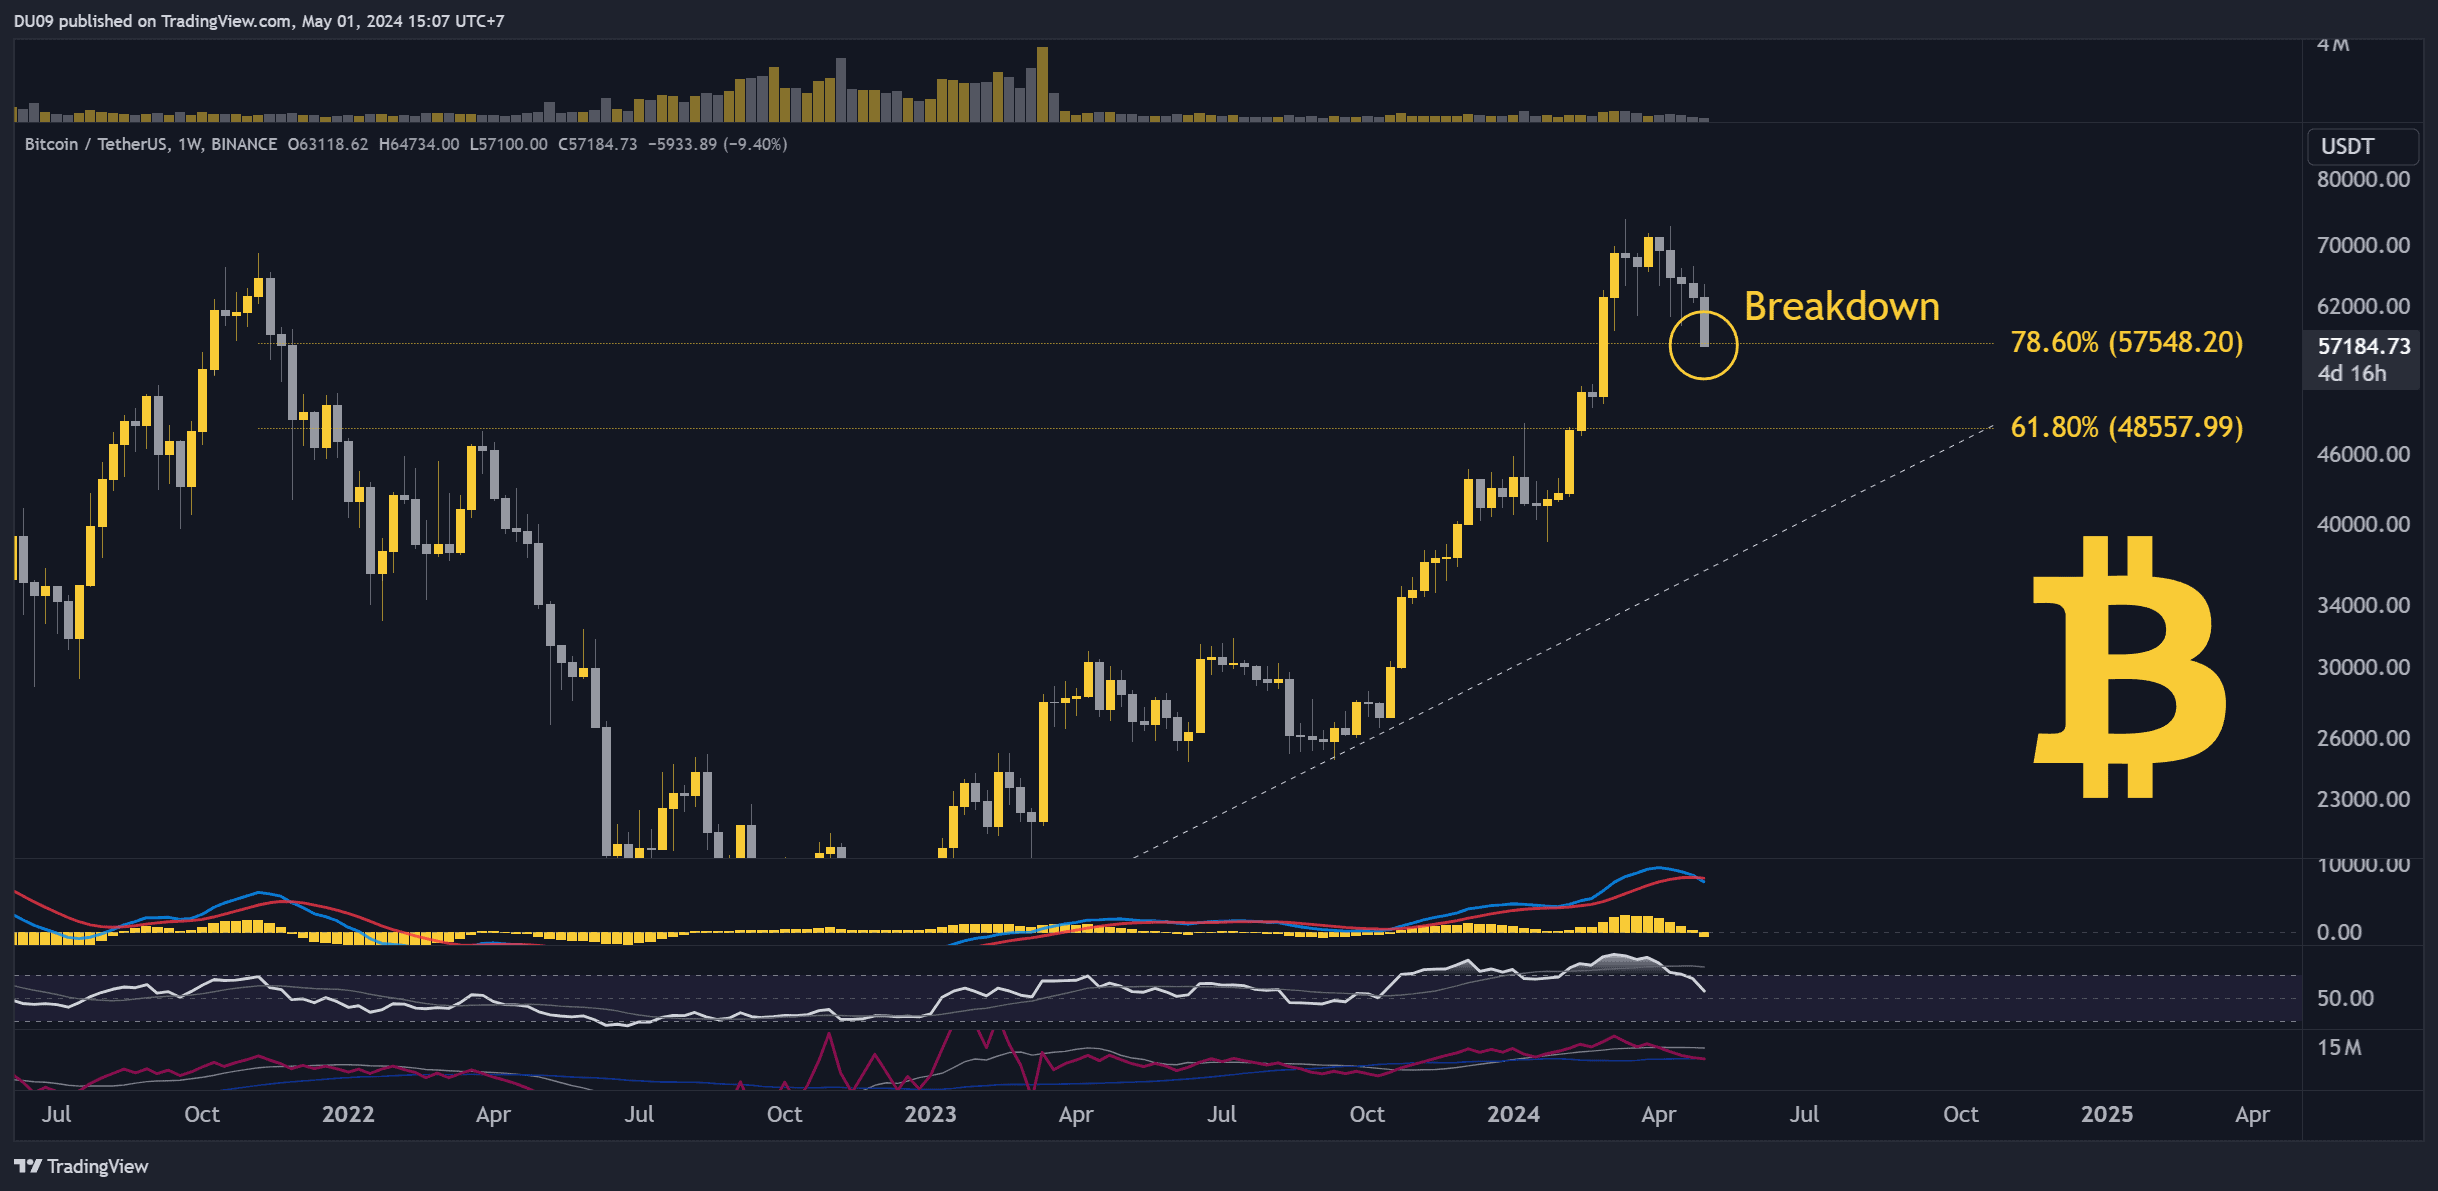
2. Momentum Remains Bearish
Bitcoin reconfirmed the downtrend with today’s price action. Bears have full control as the price appears in a free fall. If this correction continues for another month, then the price can revisit $52K or even $48K, which are the next key levels of support.
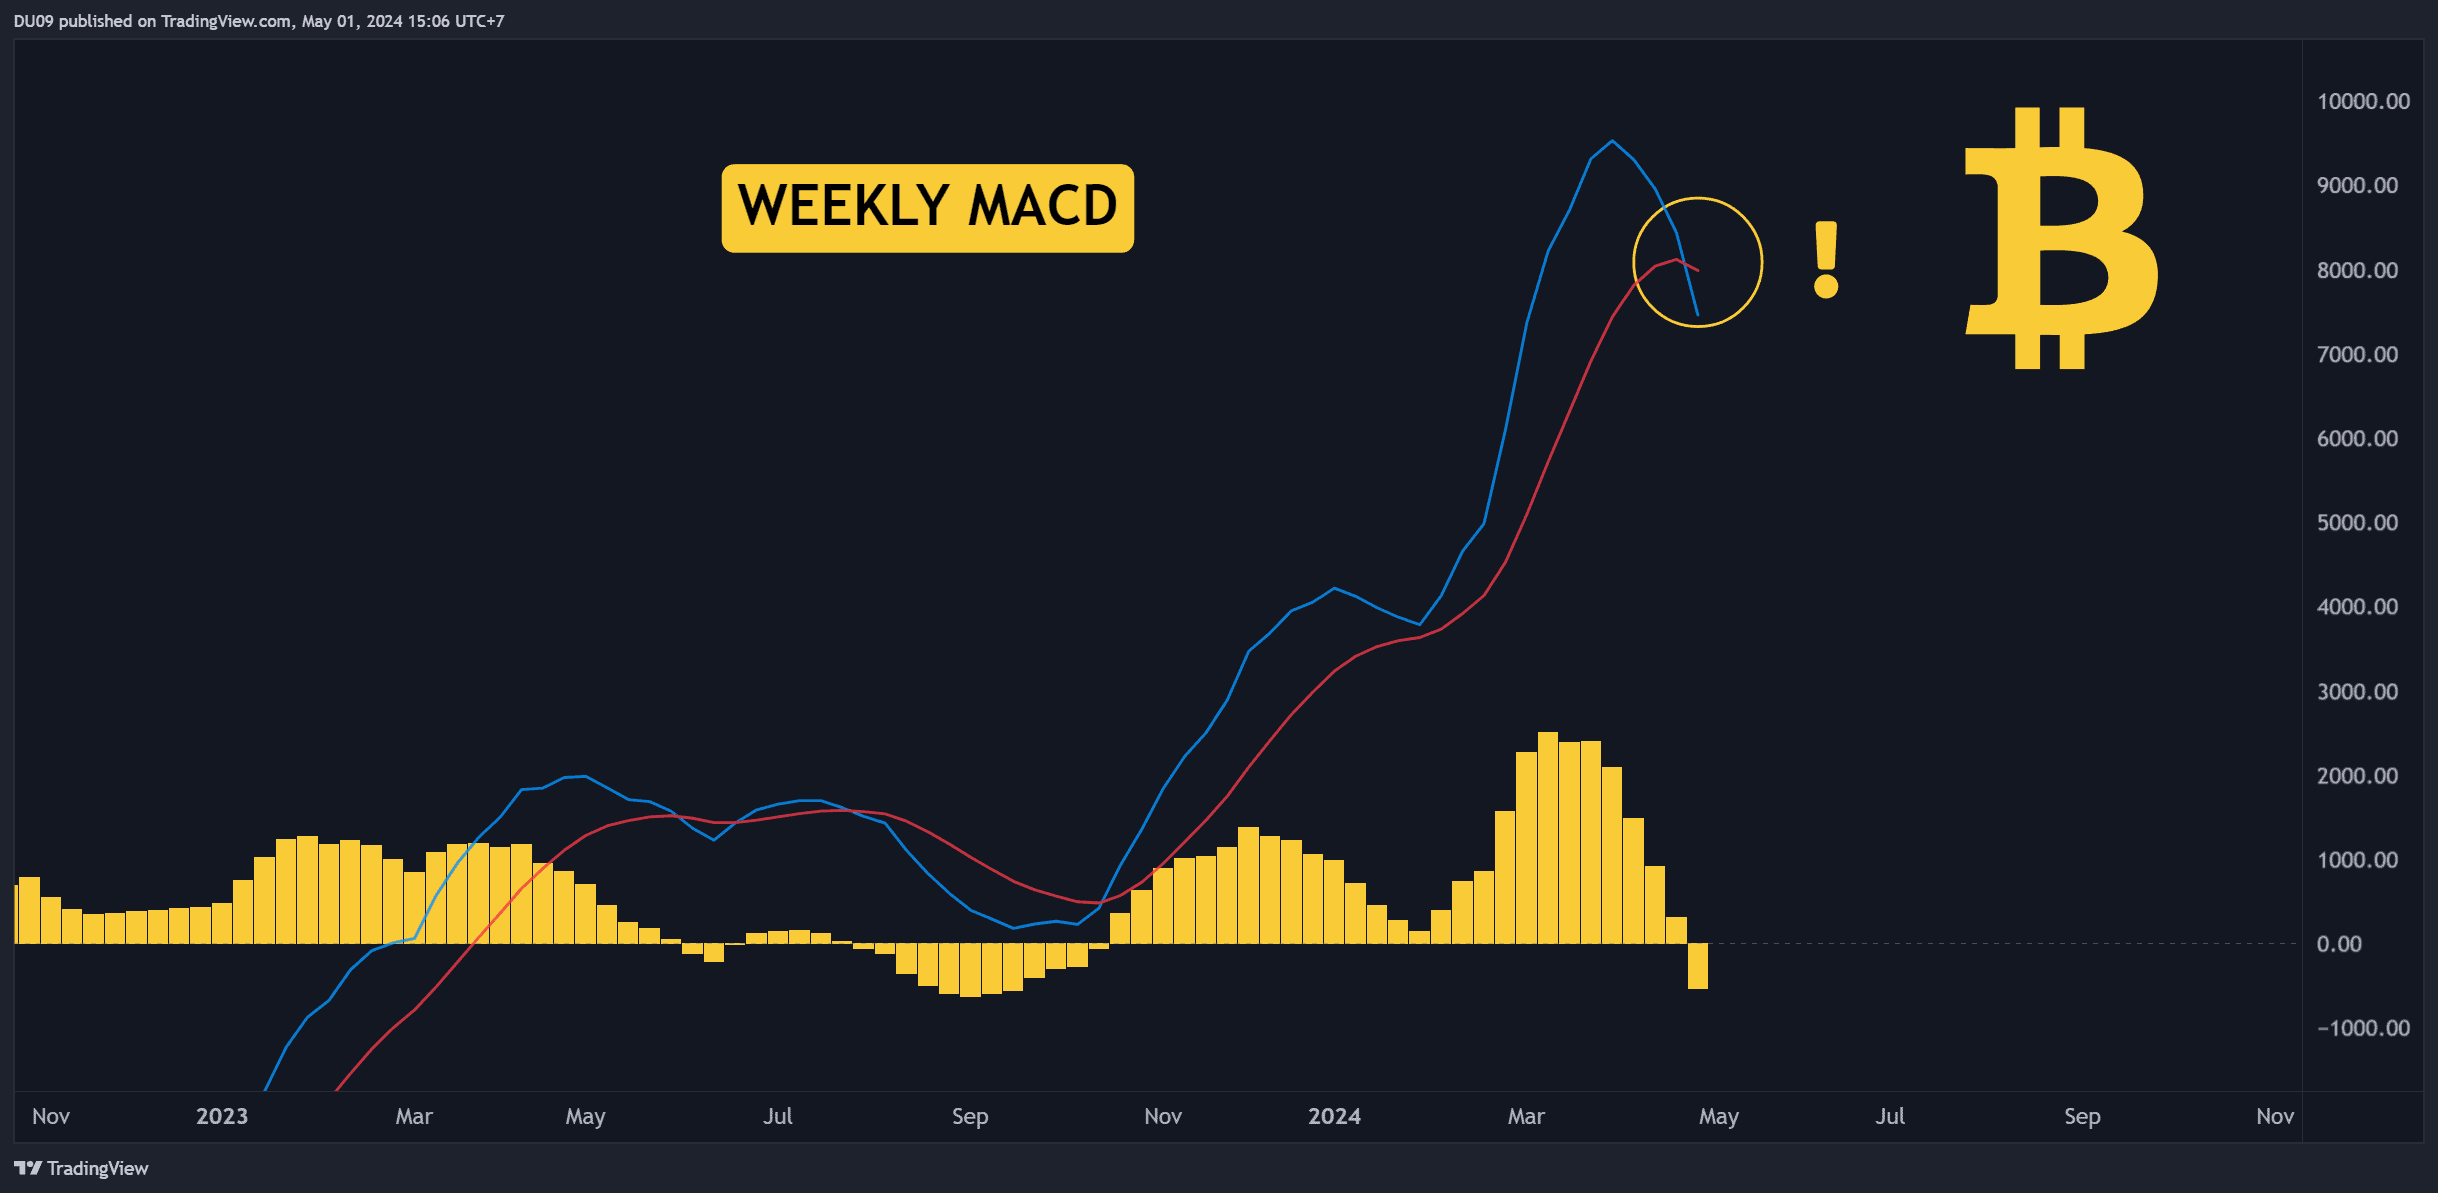
3. Weekly MACD Bearish Cross
The warning signals were loud and clear. At the start of this week, the weekly MACD made a bearish cross. This is never a good sign, and the price action was quick to reflect that in the past two days. Yesterday, Bitcoin was under $64K and today it’s at $57K. That’s over a 10% drop in 48 hours.
Looking ahead, as long as Bitcoin remains above 50k, the macro trend remains bullish. If the price goes below that level, even the most optimistic bulls will start to sweat. Such a scenario would likely send many altcoins to their starting positions from early 2023 before the bull run started.
The post The Reasons BTC Price Plunged to $57K Today appeared first on CryptoPotato.


